
Decode the market with Tokenomics Crypto. Discover how circulating supply and vesting cliffs determine a project's long-term value.
You've watched a dog-themed coin skyrocket 1000% overnight while your carefully researched Crypto pick barely moved. The difference? Tokenomics. Even the best memecoins that seem to defy logic follow predictable patterns rooted in supply mechanics, distribution strategies, and token utility design. Understanding how token supply, burning mechanisms, and allocation models influence price movements isn't just academic knowledge; it's the difference between catching a wave early and buying at the peak.
This article breaks down tokenomics fundamentals so you can evaluate any Crypto project with confidence. Whether you're analyzing supply caps, vesting schedules, or deflationary models, you'll learn why certain tokens gain traction while others fade into obscurity. Bullpen's buy Crypto platform gives you the tools to act on these insights immediately, letting you purchase tokens across multiple chains once you've identified projects with sound economic design. When you understand the relationship between circulation supply and market demand, you stop guessing and start making informed decisions.
Summary
Supply events, such as token unlocks and vesting cliffs, create predictable price pressure that most traders miss. Research analyzing over 16,000 unlock events found that roughly 90% result in negative price pressure, with detectable impacts appearing up to 30 days before the actual unlock date. Larger unlocks correlate with sharper declines and heightened volatility because markets need time to discover new price levels that reflect expanded supply.
The gap between circulating supply and Fully Diluted Valuation reveals future dilution risk that current prices often ignore. When FDV exceeds market cap by 5x or more, 80% of the eventual supply has not yet entered circulation. Low circulating supply creates exaggerated volatility on modest volume because there aren't enough tokens to absorb demand, but that same scarcity makes unlocks catastrophic.
Continuous emissions from staking rewards and liquidity mining create structural sell pressure that caps price regardless of fundamentals. When daily trading volume accounts for 3% to 5% of total volume, it drives persistent selling as participants cover costs or take profits.
Traders focus on real-time signals such as price, volume, and funding rates, while ignoring unlock schedules, emission rates, and vesting cliffs that require manual research. This creates an information gap: supply events aren't priced because most participants don't check tokenomics documentation.
Momentum-based trading breaks down when supply dynamics shift faster than sentiment can adapt. Breakouts fail near unlock dates, not because technical setups were invalid, but because new supply overwhelms demand,d driving the rally. Perpetual futures funding rates flip aggressively when large emissions approach, as informed participants reposition ahead of known supply events.
Bullpen's buy Crypto platform addresses this by surfacing unlock schedules and emission rates alongside price action in a single interface, enabling traders to position ahead of supply shocks rather than react after markets reprice.
Table of Contents
The Real Problem With Ignoring Tokenomics

Ignoring tokenomics doesn't just mean missing fundamentals. It means walking into predictable supply shocks without realizing the floor is about to drop. Tokens don't move purely on sentiment or technical setups. They move when supply dynamics shift, and if you're not tracking those shifts, you're trading blind. According to Forbes Digital Assets, over 90% of tokens launched in 2025 failed within their first year. Many of those failures weren't due to bad technology or weak communities. They collapsed because emission schedules flooded the market faster than demand could absorb. Teams that ignored calendar unlocking and inflation rates found themselves holding positions that appeared technically sound until they weren't.
The Pattern Appears Across All Trading Styles
Breakout traders see clean consolidation and rising volume, then enter long as the price pushes through resistance. What they don't see is the vesting event scheduled for three days later, which will release millions of tokens into circulation. The breakout fails not because the setup was wrong, but because the new supply overwhelmed the buy pressure that created the move in the first place. Perp traders face the same trap from a different angle. Funding rates signal bullish positioning, open interest climbs, and leverage builds. Then a large unlock hits. Spot price drops as early investors liquidate, triggering cascading liquidations on leveraged longs. The move appears to be a sentiment shift or whale manipulation, but it's simply supply mechanics playing out exactly as the vesting schedule predicted.
When Emissions Become Structural Resistance
Continuous inflation operates more quietly but just as destructively. Staking rewards, liquidity mining incentives, and ecosystem grants all emit new tokens daily. If those emissions account for even 2%-5% of daily trading volume, they create persistent selling pressure. Someone earning yield needs to cover costs or take a profit. That selling doesn't stop when price rallies. It accelerates. A token can have strong fundamentals, active development, and growing adoption, but if daily emissions consistently outpace organic buy pressure, the price will grind sideways or decline regardless. Traders see the engagement metrics and assume strength. They miss that the emission schedule is systematically capping upside, turning every rally into an exit opportunity for yield farmers rather than a sustained move higher.
Low Float Creates Misleading Signals
Insider allocations add another layer that most traders overlook. When early investors, team members, or ecosystem funds control 60% to 80% of the total supply, the circulating float you see on exchanges is artificially small. Low float makes the price volatile on the way up. A modest amount of buy pressure can push the price sharply higher because there aren't many tokens available to absorb demand. That same low float makes unlocks catastrophic. When a vesting event releases even 10% of total supply into a market where the circulating supply was previously only 20%, you've just increased available tokens by 50%. The liquidity that seemed deep enough to support the current price is no longer. Bid depth collapses, and price follows.
Seeing the Invisible Supply Shock
Traders often interpret this as a technical breakdown or loss of momentum. They look for explanations in sentiment, news flow, or chart patterns. The real explanation sits in the tokenomics documentation they never read. The unlock was scheduled months in advance. The supply shock was predictable. The only surprise was how many traders weren't watching for it.
Anticipating Supply Shocks Before the Market
Platforms like Bullpen help traders track these dynamics by surfacing unlock schedules and emission rates alongside price action and social sentiment. Instead of reacting to supply shocks after they hit, you can anticipate them and adjust your positioning accordingly. The execution infrastructure handles the trade, but the informational edge comes from understanding when and how supply expands before the rest of the market reprices it.
Why Short-Term Traders Can't Afford to Ignore This
The assumption that tokenomics only matters for long-term holders breaks down the moment you realize supply events happen on short-term timeframes. A vesting cliff can occur this week. Daily emissions create sell pressure today. Liquidity mining rewards get claimed and sold within hours. These aren't theoretical risks that play out over quarters or years. They're immediate catalysts that move the price.
Market Momentum Vs Structural Supply Constraints
Traders who ignore tokenomics aren't making a calculated decision to focus on different data. They're simply missing half the information that drives price. Momentum, volume, and sentiment matter, but they operate within constraints set by supply mechanics. When supply expands faster than demand, momentum dies. When unlocks flood the market, volume spikes on the sell side. When emissions outpace organic buying, sentiment turns bearish, not because fundamentals changed, but because the price can't sustain itself against structural selling.
The Information Arbitrage: Exploiting Public Tokenomics
The frustrating part is that these losses are preventable. Unlock schedules are public. Emission rates are documented. Vesting cliffs appear in tokenomics papers and governance proposals. The information exists. Most traders just don't look for it because they've been told tokenomics is a long-term concern, not a short-term edge. That belief costs them on every trade where supply dynamics matter more than the technical setup they're watching. But knowing tokenomics exists as a risk factor is different from understanding what it actually controls.
What Tokenomics in Crypto Actually Means
Tokenomics defines how a token's supply enters circulation, moves through the market, and behaves over time. It's the economic architecture that determines whether new tokens appear slowly or flood the market all at once, whether insiders control most of the supply or retail holds meaningful ownership, and whether incentives push holders to accumulate or sell immediately. This structure shapes price action more directly than most traders realize. The design includes several components that matter for execution, not just long-term fundamentals.
Total supply
Sets the maximum number of tokens that will ever exist. This number alone tells you nothing about current price pressure, but it defines the outer boundary of potential dilution. If the circulating supply is 10% of the total supply, then 90% could eventually enter the market
Circulating supply
Refers to the number of tokens available for trading. This is what interacts with demand today. A token with a total supply of 100 million but only 5 million circulating behaves very differently from one with 95 million already in circulation. A low circulating supply creates volatility on modest volume because there aren't enough tokens to meet demand or sell.
Emission schedules
Control how new tokens enter circulation. Staking rewards, liquidity mining incentives, and ecosystem grants all emit tokens continuously. If emissions represent 3% of the circulating supply daily and only 1% of that gets bought, you have structural sell pressure regardless of sentiment. Price can't sustain upward momentum when fresh supply consistently outpaces organic demand.
Vesting and unlock timelines
Determine when locked tokens become tradable. Team allocations, investor tokens, and advisor shares typically vest over months or years, with cliff dates at which large blocks unlock at once. A 10% unlock event in a token with 20% circulating supply increases available tokens by 50% overnight. Liquidity that seemed adequate suddenly isn't.
Utility and incentive structures
Define what the token actually does. Governance rights, staking yield, fee discounts, and revenue sharing, these create reasons to hold or use the token. But incentives can backfire. High-staking APYs attract capital, but if those rewards are sold immediately to cover costs or take profits, the program generates constant selling rather than accumulation.
Why Supply Mechanics Override Sentiment
A token can have passionate holders, active developers, and growing adoption. If daily emissions flood the market faster than new buyers enter, that imbalance shows up in price action. Rallies stall. Support levels break. Volume spikes on the sell side. Traders see this as bearish sentiment or a technical breakdown. It's just math. More tokens chasing the same liquidity means lower prices. According to research from dydx.xyz, understanding token budgets and emission rates gives traders an edge in timing entries and exits around predictable supply events. The information sits in tokenomics documentation, vesting schedules, and governance proposals. Most traders ignore it because they've been conditioned to watch charts, not contracts.
When Low Float Becomes a Trap
Insider allocations concentrate control in ways that distort price signals. When early investors, team members, and ecosystem funds hold 70% of the total supply, the circulating float you see on exchanges is artificially constrained. Low float makes modest buy pressure push the price sharply higher because there aren't many tokens available. Traders interpret this as strength. It's actually fragility. Platforms like Bullpen surface unlock schedules and emission rates alongside price action and social sentiment, helping traders identify when supply dynamics are about to shift before the rest of the market reprices it. Instead of reacting after the move happens, you can position ahead of predictable events. The execution infrastructure handles the trade, but the informational edge comes from seeing supply changes before they hit.
Emissions Create Structural Resistance
Continuous inflation operates quietly but persistently. Staking rewards, liquidity mining programs, and ecosystem grants emit new tokens daily. If those emissions account for even 2% of daily trading volume, they create persistent selling pressure. Someone earning yield needs to cover costs or realize profit. That selling doesn't pause during rallies. It accelerates.
The Yield-Emission Trap
A token can have strong fundamentals and growing usage, but if daily emissions consistently outpace organic buying, price grinds sideways or declines. Traders see engagement metrics and assume strength. They miss that the emission schedule is systematically capping upside, turning every rally into an exit opportunity for yield farmers rather than a sustained move higher.
The Extraction Incentive: Why High Apy Often Fails
Liquidity mining programs amplify this dynamic. High APYs attract capital quickly, but those rewards get sold immediately. Tokens flow back into circulation before they create lasting demand. You end up with TVL numbers that look impressive, but price action that remains flat or drifts lower. The program succeeds in attracting liquidity but fails to build sustainable value because the tokenomics incentivize extraction rather than accumulation.
What the Circulating Supply Actually Tells You
Circulating supply matters more than total supply for short-term price action. Total supply defines maximum dilution. Circulating supply defines current liquidity depth. A token with a 1 billion total supply and 100 million circulating has 10x more potential dilution than one with 500 million circulating. That future dilution creates overhang, but it doesn't move the price today. What moves the price today is the balance between available supply and current demand.
Tokenomics as Engineering: The Reality of Supply Constraints
This is where tokenomics stops being theory and starts becoming mechanics. You can track emission rates, unlock schedules, and vesting cliffs. You can calculate the daily, weekly, or monthly volume of new supply entering circulation. You can compare that to average daily volume and see whether organic demand can absorb it. These aren't predictions. They're constraints. But knowing the mechanics exists is different from understanding when they actually matter in live markets.
Related Reading
How Tokenomics Moves Price in Practice
Supply mechanics shape price behavior independent of sentiment or technical patterns. When unlock events release previously locked tokens, when emission schedules flood markets with new supply, or when staking rewards create structural sellers, these forces move price through pure arithmetic. Demand must absorb the new tokens; otherwise, the price will adjust downward. The mechanism is direct, measurable, and often predictable if you know where to look.
Unlock Events Compress Liquidity Faster Than Markets Can Adjust
When vesting schedules release large token allocations, the circulating supply expands in a single moment. If a project has 15 million tokens in circulation and unlocks 3 million more, the available supply increases by 20%. That's not a sentiment shift. It's a structural change to the supply-demand equation. Research analyzing more than 16,000 unlock events found that roughly 90% result in negative price pressure. The effect often begins 30 days before the unlock date as traders anticipate the event and reduce their positions. Larger unlocks correlate with sharper declines and higher volatility because the market must discover a new price level that reflects the expanded float.
FDV Gaps Create Illusions of Value
Fully Diluted Valuation measures what the market cap would be if all tokens were circulating. When FDV is 10x higher than the current market cap, that gap represents future dilution. A token might look undervalued at $50 million market cap, but if FDV is $500 million, you're betting demand will grow fast enough to absorb 10x more supply without collapsing price. Projects with high FDV and low float often experience exaggerated price swings. Early rallies push the price higher on modest volume because there aren't many tokens available. That same low float makes unlocks catastrophic. When vesting releases even 5% of the total supply into a market where the circulating supply was 10%, available tokens just doubled. Liquidity that seemed adequate at the current price is no longer.
The Hidden Gravity of Dilution Risk
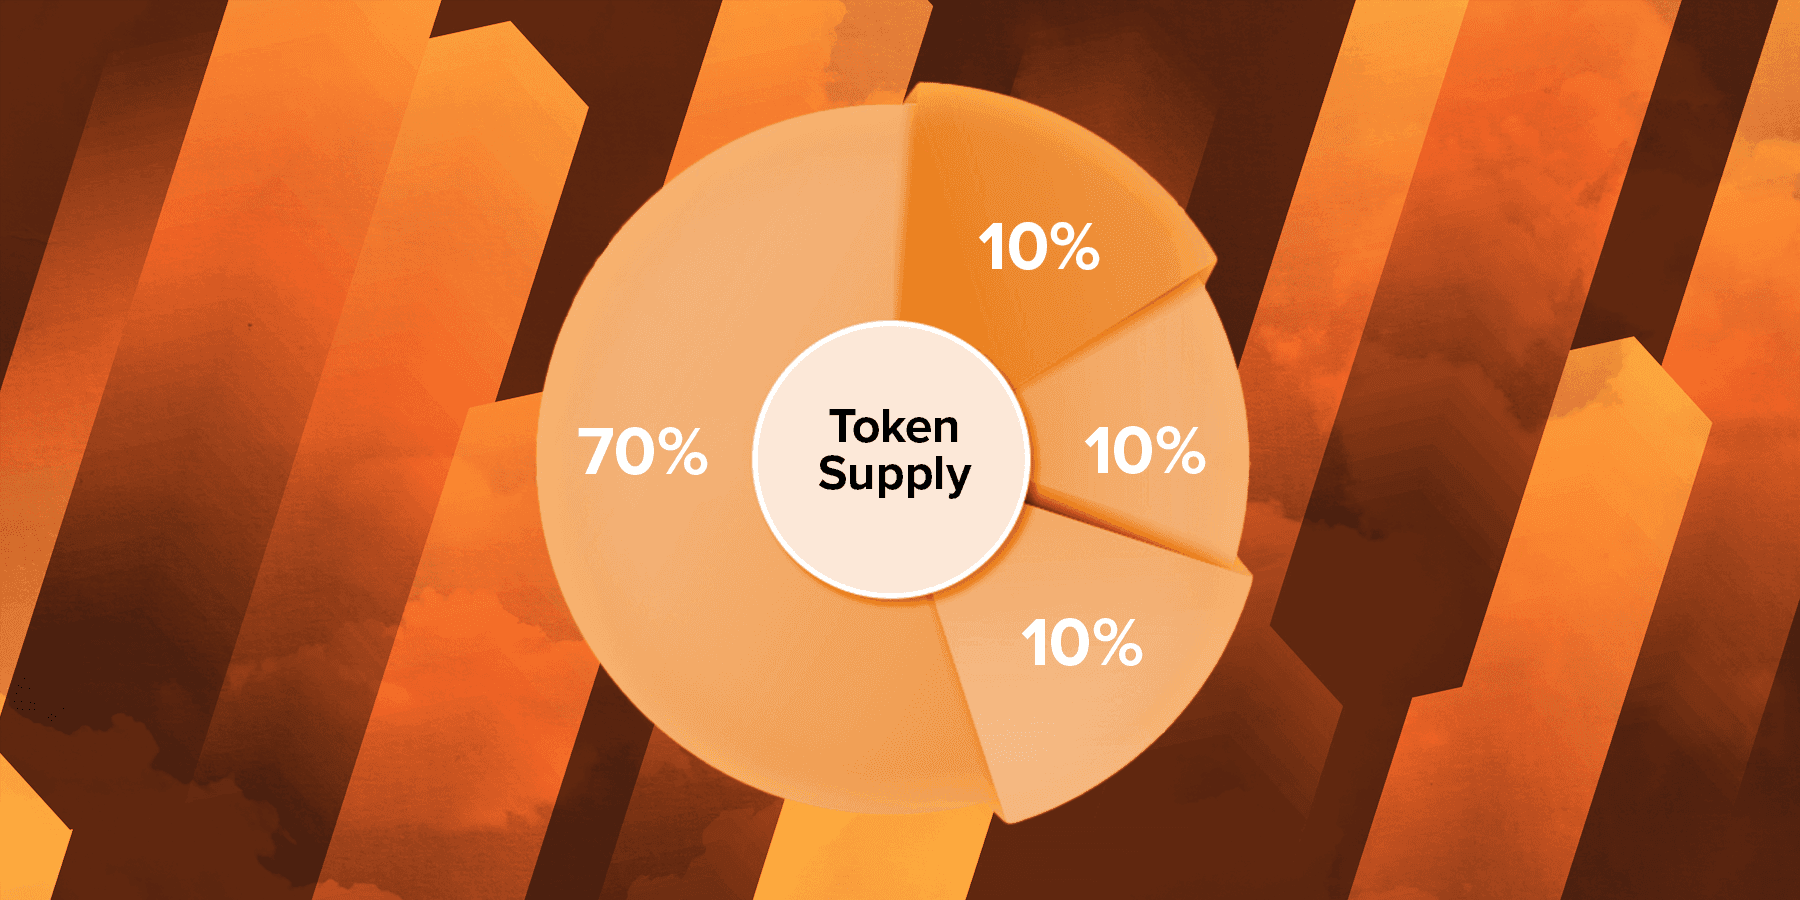
The gap between float and FDV matters because it defines dilution risk. If the circulating supply is 20% of the total supply, you're holding a position where 80% of the eventual supply hasn't entered the market yet. That overhang doesn't move the price today, but it shapes how the market values the token. Buyers discount future dilution. Sellers front-run unlock events. The FDV gap acts as a ceiling on prices until sufficient supply enters circulation to close it.
Emission Schedules Create Persistent Drag
Staking rewards, liquidity mining incentives, and ecosystem grants emit new tokens continuously. If a project emits 50,000 tokens daily and the average daily volume is 1 million tokens, those emissions represent 5% of total trading activity. Someone earning those rewards needs to cover costs or realize a profit. That selling doesn't pause during rallies. It accelerates because higher prices make selling more attractive.
The Dilution Trap of Usage-Based Emission
According to research from Webopedia, usage-based emission models can continually increase supply based on network activity. If demand doesn't grow at the same rate, the result is dilution. Price can't sustain upward momentum when fresh supply consistently outpaces organic buying. Rallies stall. Support levels break. Volume spikes on the sell side.
The Invisible Ceiling of Token Emissions
This dynamic operates quietly but persistently. You won't see a single event that drives the price down. Instead, you'll see gradual erosion. Every rally gets sold into. Every breakout attempt fails at the same resistance level. The token grinds sideways or drifts lower despite strong fundamentals because the emission schedule systematically caps upside.
You can calculate this pressure. Find the daily emission rate. Compare it to the average daily volume. If emissions exceed 2% of volume, you have structural selling pressure. If they exceed 5%, that pressure becomes dominant. Price might rally on news or momentum, but the emission schedule will reassert itself unless demand surges enough to absorb the constant flow of new tokens.
Staking Rewards Turn Holders Into Sellers
Staking locks tokens temporarily, reducing circulating supply and creating an appearance of demand. But staking also generates rewards, which in turn create sellers. When reward claim periods open, large volumes of newly minted tokens hit the market. If 10% of staked supply claims rewards simultaneously, that's a supply shock concentrated into a narrow time window.
The Invisible Supply Wall: Staking Rewards Vs. Technical Breakouts
The pattern shows up repeatedly in short-term price action. Price attempts a breakout. Volume climbs. Momentum builds. Then reward claim windows open, and sell pressure floods the market. The breakout fails not because demand disappeared, but because supply surged. Traders who don't track staking reward schedules interpret this as a technical breakdown or sentiment shift. It's just mechanics.
The Illusion of High Staking Yields
High-staking APYs amplify the problem. Attractive yields quickly attract capital, but if participants immediately sell rewards to cover costs or take profits, the program generates constant selling rather than accumulation. The tokens flow back into circulation before they create lasting demand. TVL numbers look impressive. Price action stays flat or declines. The staking program locks tokens temporarily but fails to create sustainable value because the incentive structure rewards extraction over holding.
How Supply Shocks Override Technical Setups
Breakouts often fail near unlock dates, not because the technical setup was wrong, but because supply dynamics overwhelmed demand. A trader sees clean consolidation, rising volume, and a break above resistance. The setup looks textbook. Entry triggers. Then, three days later, a vesting event releases 5% of the total supply. Spot price drops as early investors liquidate. The breakout reverses. Perpetual futures funding rates flip aggressively when large emissions or unlocks approach. Traders adjust positioning in anticipation of price pressure. Open interest drops. Leverage unwinds. What looks like a sentiment shift is actually informed participants repositioning ahead of a known supply event.
The Hidden Impact of Token Unlocks
Volatility spikes cluster more consistently around vesting cliffs than around news events. You can see this in historical price data. Mark the unlock dates on a chart. Notice how many sharp moves occur within three days of those dates. The correlation isn't perfect, but it's strong enough that ignoring unlock schedules means missing a predictable source of price volatility.
Pricing Potential Supply Shocks with Arithmetic
Platforms like Bullpen surface unlock schedules and emission rates alongside price action and social sentiment. Instead of reacting to supply shocks after they hit, you can position ahead of them. The execution infrastructure handles the trade, but the informational edge comes from seeing supply changes before the rest of the market reprices them. When you know a 10% unlock is scheduled for next Tuesday and the average daily volume is 2% of the circulating supply, you can calculate that the market likely can't absorb that supply without a price adjustment. That's not a prediction. That's arithmetic.
The Invisible Trap of Token Unlocks
The frustrating part is how often traders mistake supply-driven moves for sentiment-driven ones. They see a price drop after a breakout and assume momentum has failed or that whales have manipulated the market. The real explanation sits in the vesting schedule they didn't check. The unlock was public. The supply shock was predictable. The only surprise was how many traders weren't watching for it. But knowing supply mechanics exist is different from understanding why traders consistently underestimate their impact.
Related Reading
Why Most Traders Underestimate Tokenomics Risk
Short-term markets reward momentum until supply mechanics reassert themselves. Traders focus on what moves fast (price, volume, sentiment) and ignore what moves predictably (unlocks, emissions, vesting schedules). That focus works until it doesn't, and when it fails, the losses arrive suddenly and without warning because the catalyst was visible months in advance.
The Already Priced In Fallacy
Markets only price in information that participants actually track. If 70% of retail traders never check unlock calendars or emission schedules, those events aren't priced in for most market participants. Efficient market theory assumes informed actors. Crypto markets are fragmented, retail-heavy, and narrative-driven. A large portion of the trading base relies solely on momentum signals.
When a vesting cliff releases tokens worth 30% of average daily volume, the market reacts to the event itself, not to the schedule published six months earlier. Price drops sharply. Traders interpret this as manipulation or sentiment collapse. The real explanation sits in the tokenomics documentation they never opened. The unlock was public. The supply shock was calculable. The only surprise was how many people weren't watching. Supply expansion doesn't wait for consensus. It happens whether the market is ready or not.
The Liquidity Misconception
Some traders argue that unlocks are bullish because they increase liquidity. More tokens available should mean better price discovery and tighter spreads. That logic holds only if demand scales alongside new supply. When a vesting event releases 5 million tokens into a market where daily volume averages 2 million, even modest selling from unlock recipients overwhelms buy-side depth. Liquidity increases, but so does the available supply. If those new tokens hit exchanges faster than buyers can absorb them, the result is downward pressure regardless of how liquid the market becomes.
Liquidity is neutral
Supply without matching demand is just pressure. The distinction matters because traders often mistake increased token availability for bullish structure when it's actually creating the conditions for a sharp repricing lower.
Community Strength as a Shield
Strong communities get cited as protection against tokenomics risk. The belief is that passionate holders will absorb selling pressure from unlocks or emissions because they believe in the project over the long term. That works during bull phases when demand overwhelms supply mechanics. It breaks down the moment momentum slows. According to Sportskeeda Tech, 84.7% of Crypto tokens launched in 2025 are trading below their listing price. Many of these projects had active communities, engaged social channels, and genuine enthusiasm. They also had aggressive emission schedules, large insider allocations, and small circulating floats relative to total supply.
The Unyielding Reality of Supply Math
Community enthusiasm doesn't automatically absorb emissions. When staking rewards are emitted at 3% of the circulating supply per week, and only 1% of that is bought, the math doesn't care how passionate the holders are. Emissions continue. Unlocks continue. Supply expands whether sentiment holds or not. The community can delay the impact during periods of strong momentum, but it can't eliminate structural selling pressure indefinitely. Meme cycles can ignore fundamentals temporarily. Tokenomics reasserts itself when price stalls and the structural selling becomes impossible to ignore.
What Traders Actually Track
Most retail execution focuses on immediate signals: price movement, volume spikes, open interest changes, and funding rates. These metrics update in real time and directly influence short-term positioning. They're also incomplete. Very few traders track unlock size relative to daily volume, inflation rate as a percentage of circulating supply, reward emission cadence, or the gap between fully diluted valuation and current market cap. These metrics require data to be pulled from tokenomics documentation, vesting dashboards, and governance proposals. The information exists, but accessing it takes effort. Most traders don't invest because they've been conditioned to believe tokenomics is a long-term concern.
Seeing the Invisible Force of Token Supply
When vesting cliffs exceed typical daily trading volume, volatility spikes sharply. When inflation rates run high relative to organic demand growth, price struggles to trend sustainably upward. Ignoring these dynamics doesn't remove their impact. It just removes your awareness of them until price moves against you,u and you're left searching for explanations in sentiment or technicals that don't account for the real driver. Platforms like Bullpen surface unlock schedules and emission rates alongside price action and social sentiment, compressing the research process from manual documentation review to integrated dashboard views. Instead of reacting to supply shocks after they hit, traders can anticipate them and adjust their positions before the rest of the market reprices. The execution infrastructure handles the trade, but the informational edge comes from understanding when supply expands before liquidity adjusts.
The Belief That Momentum Tells The Whole Story
Momentum traders assume the price reflects all available information. If a token is rallying, demand must be strong. If it's dropping, sentiment must be weak. That framework works when supply remains constant. It breaks when supply dynamics shift faster than sentiment can adapt. A breakout above resistance looks clean until you realize a 15% unlock hits three days later. The technical setup was valid. The momentum was real. But the supply event created selling pressure that overwhelmed the demand, driving the breakout. Price reversed not because the setup failed, but because new supply flooded a market that couldn't absorb it.
The Invisible Hand of Tokenomics
Supply and demand mechanics don't appear on candlestick charts. They show up in vesting schedules, emission rates, and unlock calendars. The traders who check those sources before entering a position have information the momentum-only crowd doesn't. That gap creates an edge. The question isn't whether tokenomics matters. It's whether you're willing to track it before the market forces you to learn the hard way. But knowing tokenomics creates risk is different from knowing how to trade around it.
How to Trade With Tokenomics, Not Against It

If tokenomics dictates how supply enters the market, then traders need to incorporate timing and structure into their edge, not just price signals. Here are data-backed, actionable ways to align your trades with token supply mechanics.
Track Unlock Schedules Before Entering Swing Trades
Token unlock events inject real supply into the market. According to Keyrock's analysis of 16,000 token unlocks, price impacts are detectable 30 days before unlock dates, with larger unlocks causing sharper declines and increased volatility. Researchers found that these events often lead to negative price pressure as supply expands without matching demand. Monitoring these schedules helps you anticipate periods of weakness rather than react to them.
Practical Edge
Avoid initiating long exposure shortly before unlock cliffs. Scale positions down in the two to four weeks ahead of major unlocks. Use token unlock calendars (e.g., Tokenomist, Messari) as part of your scanning process. When a token you're watching has a 10% unlock scheduled for next week and average daily volume is 2% of circulating supply, the math tells you what's coming. The market can't absorb that supply without repricing. You don't need to predict sentiment. You just need to read the calendar.
Compare Circulating Vs. Fully Diluted Valuation (FDV)
Understanding how much of a token's total supply is currently trading is crucial. Fully Diluted Valuation assumes all tokens are in circulation and helps gauge future dilution risk. A high FDV relative to the circulating market cap suggests that a large portion of the supply remains locked, which can dilute the price upon unlocking. Metrics like FDV can highlight when current prices may overstate short-term scarcity.
Example
A token trading at $1 with a 100M max supply but only 20M circulating will have an FDV of $100M, five times its current market cap. If even a fraction of the locked supply is unlocked and sold, price pressure can be significant.
Practical edge
Favor tokens with moderate FDV: MCAP ratios or gradual unlock schedules. Incorporate FDV analysis into risk sizing and exit timing. When the gap between FDV and market cap exceeds 5x, you're not just betting on demand growth. You're bettingthat demand will grow faster than supply expands. That's a harder trade to win.
Watch Emission Rates Relative to Market Volume
Compare daily emissions (tokens entering circulation) against average daily trading volume. High emission: volume ratios suggest structural sell pressure. Adjust targets and time frames accordingly. When a token emits 3% of its circulating supply weekly and only 1% of that gets bought, you have a structural ceiling. Price might spike on news or momentum, but the emission schedule will reassert itself. Every rally becomes an exit opportunity for yield farmers, not a sustained move higher.
Align Leverage Exposure Around Supply Events
Tokenomics isn't just a fundamental concern. It's a timing signal that interacts with leveraged markets. Around scheduled supply events (large unlocks or reward claim periods), derivatives markets often see funding rate flips as traders adjust to expected price pressures, wider bid-ask spreads in perp order books, and higher realized volatility. By aligning leverage exposure with tokenomics calendars, you can reduce the risk of liquidation during engineered supply shocks. Instead of betting on pure sentiment, you're trading known supply catalysts.
Practical Edge
Reduce leveraged exposure leading into unlock dates. Shift to shorter time frames or hedged structures around emission peaks. Consider volatility plays (e.g., straddle positions) if you expect big price swings but aren't sure of direction.
Anticipating Market Pressure Before the Crowd
Traders who incorporate unlock schedules, FDV analysis, emission rates, and supply event timing into their process gain an edge not by predicting sentiment, but by understanding where structural pressure exists in the market. Platforms like Bullpen surface unlock schedules and emission rates alongside price action and social sentiment, compressing the research process from manual documentation review to integrated dashboard views. Instead of reacting to supply shocks after they hit, traders can anticipate them and adjust their positions before the rest of the market reprices.
Tokenomics as a Timing Mechanism
The critical difference between traders who survive tokenomics events and those who get caught is simple: one group checks the calendar, the other doesn't. Unlock schedules, emission rates, and vesting cliffs are public information. They're not hidden. They're not insider knowledge. They're just not on the candlestick chart. When you know a 15% unlock hits next Tuesday and daily volume averages 3% of circulating supply, you don't need to predict what will happen. You can calculate it. Supply will exceed demand unless something changes dramatically. Price will adjust. The only question is whether you positioned ahead of it or got caught holding through it.
Finding the Edge in Hidden Data
This isn't about being smarter than the market. It's about reading information the market hasn't priced in yet because most participants aren't considering it. That gap between what's knowable and what's known creates edge. The traders who exploit it aren't predicting the future. They're just doing the homework everyone else skipped. Tokenomics isn't just research. It's timing. But knowing when supply shocks are coming is only half the equation if you're still switching between five different platforms to track them.
Related Reading
How Bullpen Helps You Trade Tokenomics Events in One Place
If tokenomics is about timing supply shocks, then execution speed matters just as much as analysis. Supply events don't wait for you to bridge funds or move capital between exchanges. They definitely don't wait while you're checking three dashboards to see what smart money is doing. That's where Bullpen becomes the execution layer. With Bullpen, you can trade Bitcoin, Solana meme coins, Hyperliquid perps, and Polymarket positions all inside one app. When volatility spikes around a token unlock or emission event, you can use leverage immediately without moving funds between wallets or exchanges. That matters because tokenomics-driven moves often occur quickly, especially when vesting cliffs exceed typical daily volume.
Visibility Into Profitable Positioning
Instead of guessing how the market will react to a major unlock, you can follow top traders on X with verified PNLs, see a live leaderboard of who's actually winning, and get notified the moment high-performing traders open a position. That reduces one of the biggest risks during supply events: acting in isolation.
Eliminating the Anxiety of Token Unlocks
Traders express concern about missing moves during major token unlocks because they can't act fast enough. The anxiety is real. When a $308M unlock hits, and you're still figuring out which exchange has liquidity, the opportunity window closes before you execute. Bullpen removes that friction by consolidating execution paths so you can respond to supply shocks as they unfold, not after they've already repriced.
Funding Without Fragmentation
When you need to fund quickly, Bullpen removes friction. Buy Crypto with Apple Pay or use your bank account. Deploy capital without juggling bridges or wallets. This directly solves the earlier problems. No scrambling across platforms to react to unlock volatility. No missing the move because your funds are fragmented. No guessing who's profitable because you see real PNLs live.
Why Unified Infrastructure Matters for Timing Plays
Tokenomics events are timing games. The difference between catching a pre-unlock short and watching it happen from the sidelines often comes down to whether your capital is already positioned. If you're waiting for a bridge to confirm or transferring USDC between three different wallets, you're already late. Bullpen gives you the infrastructure to act on that timing: fast, leveraged if needed, and informed by traders who are already proving their edge. The platform doesn't predict which unlocks will drive price crashes or which emissions will be absorbed. It ensures you can execute once you've done the homework and identified the opportunity.
Buy Crypto Today with Bullpen
Tokenomics stops being a theory the moment you miss a move because your capital sat fragmented across three wallets while a supply shock reprices the market. The information was public. The unlock schedule was visible. The only gap was execution speed.
The All-in-One Command Center for Crypto
Bullpen removes that friction by letting you trade Bitcoin, Solana meme coins, Hyperliquid perps, and Polymarket positions from one interface. When a vesting event hits and volatility spikes, you can deploy leverage immediately without bridging funds or switching platforms. You can also see what profitable traders are doing in real time through verified PNLs and live leaderboards, reducing the risk of acting in isolation during supply-driven moves. Deposit today to earn a 500-point bonus. Deposit $1,000 or more and get a free introductory call. Buy Crypto with Apple Pay or your bank account and start trading smarter, faster, and all in one place.
Last Updated:
March 23, 2026