
Ethereum Tokenomics explained: Learn how ETH supply, staking rewards, and burn mechanisms impact value. Master the basics of the ETH economy now.
Whether you're chasing the next big thing in Best Memecoins or trying to understand why Ethereum's price moves the way it does, the economics behind ETH matter more than you might think. Ethereum's tokenomics, the supply mechanics, burn rates, staking rewards, and issuance schedules, shape everything from network security to your portfolio's performance. This article breaks down how ETH supply dynamics actually impact price, giving you the knowledge to make smarter decisions about when to enter or exit positions.
Understanding these supply-and-demand fundamentals becomes even more powerful when you have the right tools at your fingertips. That's where Bullpen's buy Crypto solution comes in, offering you a straightforward way to act on your insights about Ethereum's monetary policy shifts and supply constraints. Instead of watching from the sidelines as ETH transitions through major protocol upgrades that affect inflation rates, you can position yourself to benefit from the tokenomic changes that drive long-term value.
Summary
Ethereum's supply is not permanently deflationary despite widespread belief after EIP-1559 and The Merge. Post-Merge issuance is down roughly 90% relative to Proof of Work, but the network still issues around 1,700 ETH daily to validators. The burn mechanism only activates when users pay gas fees, meaning ETH alternates between net deflationary during high-activity periods and net inflationary during quiet markets.
More than 4 million ETH have been permanently burned since August 2021 through base fee destruction, according to Ultrasound.money data. During high-demand windows in 2023 and 2024, daily burn exceeded validator issuance for sustained periods, creating structural price support.
Staking now locks over 30% of the total ETH supply, removing it from active trading circulation and amplifying volatility when demand shifts occur. Reduced float means smaller capital inflows create larger percentage price moves. But since the Shanghai upgrade enabled withdrawals in April 2023, this compression is reversible.
Ethereum's net issuance rate swung between negative 0.2% annualized during peak activity months and positive 0.4% during quieter periods, according to OKX's 2023 tokenomics report. That 0.6% swing in annualized supply growth might sound small, but in a $200 billion asset with thin liquidity, small percentage moves in supply create outsized price pressure.
Supply regime transitions from positive to negative net issuance (or vice versa) often precede volatility expansions in reflexive markets like Crypto. The inflection points matter more than static levels because they create uncertainty about structural support, which shows up as widening spreads and repositioning flows.
Bullpen's buy Crypto platform addresses these execution gaps by offering spot and perpetual ETH trading in one interface, enabling traders to respond immediately when burn accelerates or issuance expands, rather than waiting through multi-platform delays as supply dynamics shift.
Table of Contents
The Real Problem With Misunderstanding Ethereum Tokenomics
Most traders locked onto “ultrasound money” and stopped paying attention. They think Ethereum became permanently deflationary after EIP-1559 and The Merge, so supply mechanics no longer matter. That interpretation isn't just incomplete. For anyone trading ETH, it's dangerous. Ethereum's tokenomics aren't static. They're dynamic and activity-driven, so the supply picture changes constantly based on onchain activity.
ETH Issuance Still Fluctuates
Post-Merge, Ethereum issues new ETH to validators who secure the network. While issuance dropped significantly compared to Proof of Work, from roughly 13,000 ETH per day to around 1,700 ETH, it didn't disappear. The amount issued depends on the amount of ETH staked. As staking participation rises, total issuance adjusts accordingly.
The Burn Rate Depends Entirely On Network Activity
EIP-1559 introduced a base-fee burn mechanism, but the burn occurs only when users pay gas. During high-activity periods, burn can exceed issuance, making ETH net-deflationary:
NFT mints
DeFi surges
Memecoin mania
During quiet markets, burn slows, and issuance can outpace it. That means ETH can alternate between net deflationary during high-demand cycles and net inflationary during low-usage periods. It's not permanently one or the other.
Staking Changes Circulating Supply Dynamics
When ETH is staked, it's removed from liquid circulation. That reduces effective float and can compress available supply. But staking isn't a one-way lock forever. Staked ETH can be withdrawn, especially after the Shanghai upgrade enabled validator exits in April 2023.
The Staking Queue as a Liquidity Lag Indicator
Validator exits increase liquid float. When validators withdraw and unstake, previously locked ETH becomes liquid again. If large amounts are staked during risk-off periods, that increases the circulating supply when demand may already be weak. This is the part many traders miss. They treat Ethereum as if its supply is fixed and shrinking. In reality, supply compression and expansion depend on:
Network usage
Gas demand
Staking participation
Validator behavior
The Staking Queue as a Liquidity Lag Indicator
The core tension? Ethereum's tokenomics are dynamic, not fixed, and that volatility affects traders. If you're trading ETH without tracking supply dynamics, you're reacting to price without understanding what's pushing against it. And in a market where marginal supply matters, that blind spot shows up in volatility. Most traders monitor price action and may check a few technical indicators. They'll watch:
Resistance levels
Volume spikes
Momentum shifts
But they're not tracking whether ETH is net-inflationary or net-deflationary that week. They're not monitoring staking queue depth or validator exit rates. They're not correlating gas spikes with burn acceleration.
Net Issuance Equilibrium
Platforms like buy Crypto help traders act on these tokenomic shifts by offering execution tools that respond to real-time onchain conditions. Instead of guessing whether supply is tightening or loosening, you can position trades around the economic mechanics that drive ETH's value, from gas optimization during high-burn periods to capital efficiency when supply dynamics shift. When you miss the supply side, you're trading blind. You see the price move, but you don't know if it's demand-driven or supply-constrained. You don't know whether the rally has fuel or is running on fumes. You don't know if the dip is capitulation or just a temporary expansion in liquid float.
MEV-Boost and the “Invisible” Sell Pressure
According to research from OKX, Ethereum's net issuance rate swung between negative 0.2% annualized (deflationary) during peak activity months and positive 0.4% (inflationary) during quieter periods. That's a 0.6% swing in annualized supply growth, which might sound small until you realize it's happening in a $200 billion asset. Small percentage moves in supply can create outsized pressure on price when liquidity is thin. The traders who understand this aren't just watching charts. They're watching the protocol itself. Understanding that Ethereum's supply is dynamic is one thing. Knowing what that actually means for your trades is another key factor.
What Ethereum Tokenomics Actually Means
Ethereum tokenomics refers to how ETH is created, destroyed, locked, and circulated over time. Unlike Bitcoin, Ethereum does not have a fixed hard cap. Its supply changes depending on protocol rules and network activity. That makes the supply dynamic rather than permanently deflationary. Here are the core components that matter.
Total ETH Supply (No Hard Cap)
Ethereum has no maximum supply limit. The total number of ETH in circulation changes over time due to issuance and burn. That means supply is not fixed. It adjusts based on network conditions. Total supply alone is less important than the rate at which it is expanding or contracting. Absolute numbers matter less than velocity and direction. A growing supply during high demand can still push prices up. A shrinking supply during low demand can still lead to price declines.
Issuance to Validators (Post-Merge)
After the Merge, Ethereum transitioned to Proof-of-Stake. New ETH is issued as rewards to validators who stake ETH and secure the network. Issuance depends primarily on the amount of ETH staked. As staking participation increases, reward rates adjust, but issuance continues. Ethereum did not eliminate issuance. It reduced it significantly compared to Proof of Work. The protocol still creates new ETH every block. That creation rate fluctuates with staking behavior. When more validators join, total issuance grows. When validators exit, it contracts.
EIP-1559 Base Fee Burn Mechanism
EIP-1559 introduced a structural burn mechanism. Each Ethereum transaction includes a base fee, which is permanently burned. The amount burned depends entirely on network usage. When activity and gas demand are high, more ETH is burned. When activity slows, burn declines. The burn is demand-driven. That creates a direct link between onchain activity and supply compression. During NFT mints, DeFi surges, or memecoin frenzies, burn can spike dramatically. During bear markets or quiet periods, burn can drop to negligible levels. The protocol doesn't care about sentiment. It only responds to usage.
Net Issuance (Issuance Minus Burn)
This is the metric traders should focus on. Net issuance equals validator issuance minus ETH burned. If the amount burned exceeds issuance, the ETH supply contracts during that period. If issuance exceeds burn, supply expands. Ethereum can shift between inflationary and deflationary phases depending on usage. That makes the supply dynamic rather than permanently deflationary. You can't assume ETH is always tightening. Some weeks it expands. Some weeks it contracts. The difference shows up in price volatility when liquidity is thin.
Staked ETH vs. Liquid ETH Supply
Not all ETH is actively tradable. A large portion is staked with validators, locked in DeFi, or held long term. When more ETH is staked, the liquid supply decreases. That reduces available float in the market. Because staking withdrawals are enabled, staked ETH can re-enter circulation. If validators exist in size, the liquid supply increases. Circulating supply, therefore, changes with staking behavior. Validator exits increase liquid float at a time when markets may already be weak. Staking entries reduces float during periods when demand might be rising. These shifts don't happen in isolation. They occur in response to market conditions, so supply changes can amplify price movements rather than dampen them.
What This Means for Traders
Ethereum's supply expands or contracts based on network usage and staking behavior. High gas demand increases burn and can compress supply. Low activity reduces burn and can expand supply. This creates shifting supply regimes. Most traders track price charts, volume, and momentum. They're not monitoring whether ETH is net-inflationary or net-deflationary that week. They're not watching the staking queue depth or validator exit rates. They're not correlating gas spikes with burn acceleration. That gap shows up when volatility spikes and they don't understand why.
The Real Yield Spread
Platforms like buy Crypto help traders act on these tokenomic shifts by offering execution tools that respond to real-time onchain conditions. Instead of guessing whether supply is tightening or loosening, you can position trades around the economic mechanics that drive ETH's value, from gas optimization during high-burn periods to capital efficiency when supply dynamics shift.
The Liquidity-to-Float Ratio: Spotting “Air Gaps” in Rallies
When you miss the supply side, you're trading blind. You see the price move, but you don't know if it's demand-driven or supply-constrained. You don't know whether the rally has fuel or is running on fumes. You don't know if the dip is capitulation or just a temporary expansion in liquid float. Understanding that supply is dynamic is one thing. Knowing when those dynamics shift, and what that means for price action, is another.
Related Reading
How Ethereum Tokenomics Moves Price in Practice
Ethereum's price responds to measurable shifts in issuance, burn, and liquid supply. These aren't background variables. They create the conditions that amplify or dampen volatility. When traders track these mechanics, they see inflection points before they show up in price action.
High On-Chain Activity Compresses Supply Through Burn
EIP-1559 burns the base fee from every transaction. When network usage spikes, burn accelerates. During NFT booms, DeFi surges, or memecoin cycles, daily burn can exceed validator issuance for sustained periods. Since August 2021, more than 4 million ETH have been permanently removed from circulation through base fee burns. That's not a theoretical number. It's ETH that would otherwise be in liquid circulation, available for sale.
The Burn-to-Issuance Spread as a Leading Indicator
During high-demand periods in 2023 and 2024, Ethereum moved into net-deflationary territory for weeks at a time. Supply growth didn't just slow. It reversed. That compression provides structural support for price strength as speculative demand rises. The correlation isn't perfect, but it's consistent. Rallies often align with periods when burn outpaces issuance. Traders who monitor burn rates can see when supply dynamics are tightening before funding rates spike or momentum indicators confirm the move.
Low Activity Expands Supply and Creates Subtle Pressure
The opposite dynamic matters just as much. When network usage drops, base fee burn declines. Validator issuance continues regardless of demand levels. Post-Merge issuance dropped roughly 90 percent compared to Proof of Work, according to Ethereum Foundation data, but it didn't disappear. When burn slows, net issuance becomes positive again.
The 16 Gwei Threshold: Ethereum’s Supply Tipping Point
During periods of low activity, Ethereum's supply quietly expands. This creates structural pressure, especially in sideways or risk-off markets. Traders often interpret weakness as a sign of deteriorating sentiment. Sometimes it's simply reduced burn relative to issuance. That distinction changes how you position. If supply is expanding during a dip, the move might have more room to run. If supply is tightening during a dip, the move might be shallow and short-lived.
Staking Participation Removes ETH From Active Trading
Staking changes the effective supply by locking ETH with validators. As of early 2025, more than 30% of the total ETH supply is staked, according to KuCoin data. That removes a significant portion from active trading circulation. When stakeholder participation increases, liquid float decreases. Reduced float amplifies upside volatility because fewer coins are available on exchanges relative to demand. If speculative interest rises while the liquid supply is contracting, price moves become sharper. Small inflows create larger percentage gains when the available float is thin. This supply-tightening effect can magnify rallies during high-activity phases. It also means that staking trends matter for volatility forecasting, not just yield calculations.
Validator Exits Increase Liquid Supply and Shift Float Dynamics
Staking isn't permanent. Since the Shanghai upgrade enabled withdrawals in April 2023, staked ETH can re-enter circulation. If validator exits rise during risk-off periods, liquid supply increases right when demand may already be weak. In mid-2023, following the Shanghai withdrawal, withdrawal queues briefly exceeded 1 million ETH as validators adjusted their positions. While much of that ETH was restaked, periods of elevated exits create temporary inflection points in the supply expansion.
The Churn Limit and Supply Bottlenecks
This is where many traders get caught. They see price weakness and assume it's purely sentiment-driven. But if validator exits are spiking, you're also dealing with a structural increase in sell-side pressure from previously locked supply hitting the market. Tracking validator exit rates gives you advance notice of these supply shifts. When the exits accelerate, the liquid float expands. When they slow, float contracts. That information changes how you interpret price action.
The Blob Fee Floor: Ethereum’s New Revenue Engine
Most traders focus only on sentiment and ignore supply mechanics. Buy Crypto for Bullpen helps traders act on these tokenomic shifts by offering execution tools that respond to real-time onchain conditions. Instead of guessing whether supply is tightening or loosening, you can position trades around the economic mechanics that drive ETH's value, from gas optimization during high-burn periods to capital efficiency when supply dynamics shift.
How This Shows Up in Observable Trading Behavior
These supply mechanics create patterns that are evident in the market. ETH rallies often coincide with high burn periods, when strong onchain activity compresses supply growth. Funding rates on perpetual futures respond to shifts in issuance and demand, especially in high-burn environments when bullish positioning increases. Volatility clusters during macro events plus issuance inflection points, such as activity spikes or staking unlock waves. Price doesn't move in isolation from these variables. It responds to them, sometimes with a lag, sometimes immediately. The traders who understand this aren't just watching charts. They're watching the protocol itself.
The Churn Limit: Predicting “Supply Gaps” Before They Happen
According to research from OKX's, Ethereum's net issuance rate swung between negative 0.2% annualized (deflationary) during peak activity months and positive 0.4% (inflationary) during quieter periods. That's a 0.6% swing in annualized supply growth. Small percentage moves in supply create outsized pressure on price when liquidity is thin. Ethereum's tokenomics are not static. Supply expands and contracts based on activity, staking participation, and validator behavior. ETH price often reflects supply compression or expansion cycles, not just narrative momentum.
Regime Shifts: Inflationary vs. Deflationary Volatility
When traders ignore burn trends, staking ratios, or issuance shifts, they focus only on sentiment. But in Ethereum's case, structural supply mechanics frequently shape the volatility they're trying to trade. Most traders assume they understand supply dynamics because they know about EIP-1559 and The Merge. But knowing the mechanism exists is different from tracking when it shifts.
Why Most Traders Underestimate ETH Supply Dynamics
Traders underestimate Ethereum's supply dynamics because they've internalized a narrative that no longer matches reality. They treated “ultrasound money” as permanent rather than conditional. They treat deflationary weeks as proof of a trend, not evidence of a cycle. And they ignore the fact that Ethereum's tokenomics shift with every change in network activity, staking behavior, and validator exits. The gap between perception and reality creates blind spots. Those blind spots show up as unexpected volatility.
The Narrative Became Static While the System Stayed Dynamic
After EIP-1559 and The Merge, the story simplified. ETH became “ultrasound money.” Issuance dropped. Burn was introduced. Deflationary weeks made headlines. That framing implied permanence. It suggested Ethereum had crossed a threshold into permanent scarcity. The reality is more nuanced. Ethereum's supply regime depends on usage. When gas demand is strong, burn can exceed issuance. When:
Activity slows
Burn falls
Net issuance turns positive again
The supply regime changes with cycles. Narrative compresses that complexity into a slogan. Traders internalize the slogan and stop tracking the underlying variables.
Burn Feels Like a Guarantee Until It Isn't
Burn reduces supply growth, but only when usage justifies it. Gas demand fluctuates with:
DeFi activity
NFT trading
Memecoin cycles
Broader market speculation
When demand declines, burn declines. Validator issuance continues regardless. That means Ethereum can shift from deflationary to inflationary depending on activity levels. The burn mechanism is dynamic, not constant. Traders who assume burn equals guaranteed scarcity often overlook its sensitivity to usage. They see the mechanism and assume it operates at full capacity at all times. It doesn't.
The ETH/L2 Economic Dependency
According to Amberdata's Q1 2025 Ethereum Market Intelligence Report, ETH supply decreased by 0.15% in Q1 2025. That contraction happened during a period of elevated network activity. But contraction isn't guaranteed every quarter. When activity drops, that 0.15% can easily reverse.
Staking Compresses Supply Until Validators Exit
Staking reduces circulating float. That part is accurate. Over 28 million ETH staked on the Beacon Chain removes a significant portion from active trading. When staking participation rises, liquid supply contracts. But staking is not the same as permanent lockup. Since withdrawals were enabled, staked ETH can exit and re-enter circulation. Validator behavior changes with yield expectations, price conditions, and macro risk appetite. If staking participation declines during risk-off periods, liquid supply rises just as demand may already be weakening.
The Churn Rate: Trading Validator Exit Spikes
Staking compresses supply, until it doesn't. The compression is real, but it's reversible. Traders who treat staked ETH as permanently locked miss the inflection points when that supply becomes liquid again.
The Mental Model Is Fixed, the System Is Not
Most traders anchor to a fixed mental model:
Deflationary
Permanently scarce
Structurally bullish
That model made sense during the initial post-Merge euphoria. It stopped making sense once the data showed the extent of variance in net issuance across different activity regimes. Ethereum's supply depends on three moving variables:
Network activity (which drives burn)
Taking participation (which affects the liquid float)
Validator behavior (which determines liquidity shifts)
The “Blob Fee” Threshold: Predicting the Next Burn Spike
All three are cyclical. That means Ethereum's tokenomics are cyclical as well. Markets do not reward static assumptions in dynamic systems. Ethereum is not permanently deflationary. It is conditionally deflationary. It is not permanently supply-constrained. It is dynamically supply-adjusted.
Why This Gap Matters for Execution
Traders who understand when supply is tightening or expanding gain an informational edge. Those who rely on slogans trade headlines. And in volatile markets, mechanics usually win over memes. When you track burn trends, staking ratios, and issuance shifts, you're not just watching price. You're watching the economic forces that shape price. You see inflection points before they become obvious. You can determine whether a rally has structural support or is running on momentum alone.
Duration Risk and the “Liquidity Fuse”
Most traders monitor price action, volume, and maybe a few technical indicators. They're not correlating gas spikes with burn acceleration. They're not tracking validator exit queues. They're not monitoring whether ETH is net-inflationary or net-deflationary that week. That gap shows up when volatility spikes and they don't understand why. Buy Crypto from Bullpen helps traders act on these tokenomic shifts by offering execution tools that respond to real-time onchain conditions. Instead of guessing whether supply is tightening or loosening, you can position trades around the economic mechanics that drive ETH's value, from gas optimization during high-burn periods to capital efficiency when supply dynamics shift.
Related Reading
How to Trade Ethereum With Tokenomics in Mind
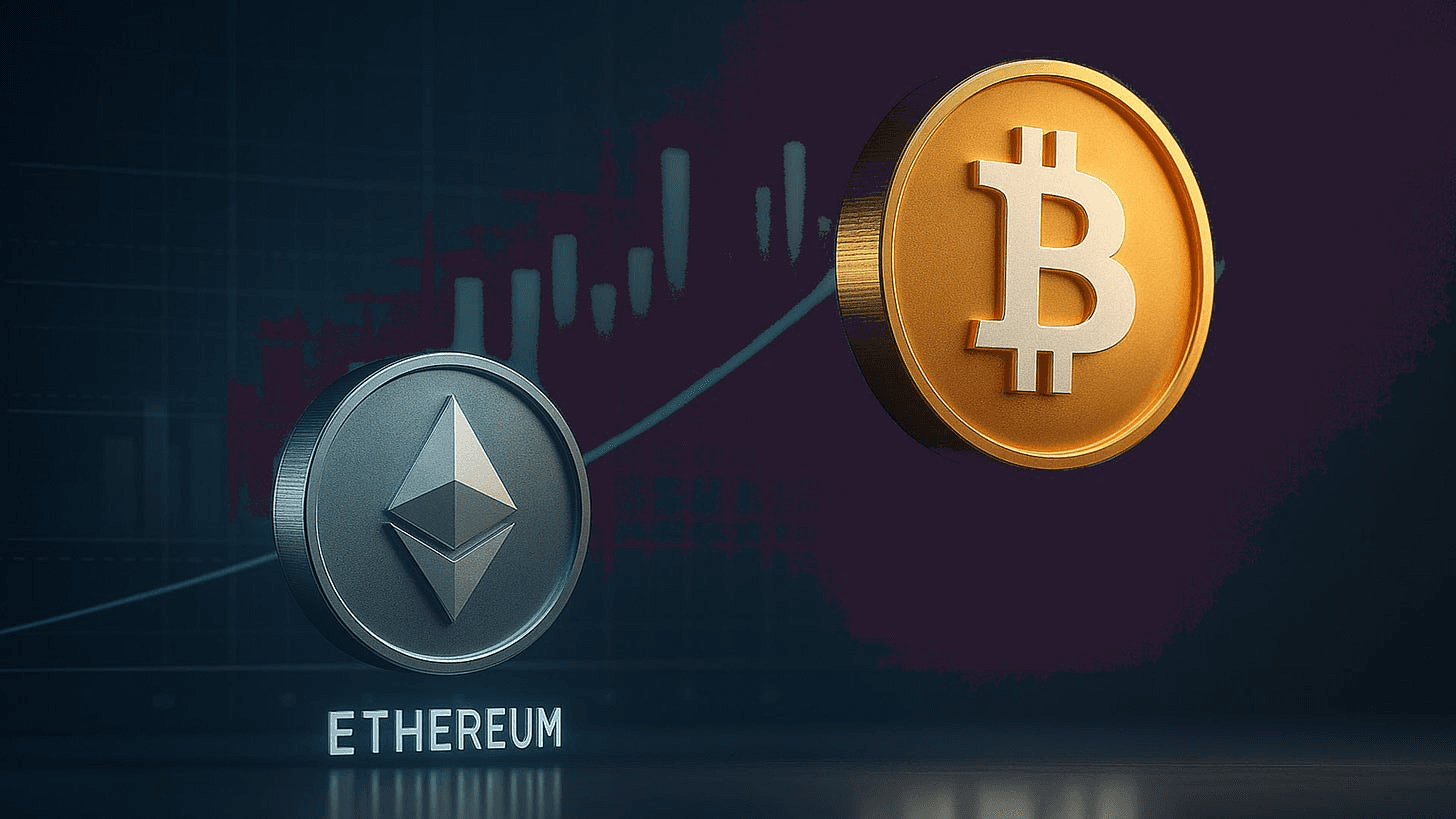
If Ethereum's supply expands and contracts based on activity and staking behavior, the edge is not in knowing the numbers. It's in knowing when those numbers matter for volatility and positioning. Here's how to trade it tactically.
Monitor Regime Shifts, Not Headlines
Ethereum has alternated between inflationary and deflationary regimes multiple times since the Merge. What matters is not whether ETH is deflationary in a given week. It's when the regime shifts. Research on supply-driven assets shows that inflection points in supply growth often precede volatility expansions, especially in reflexive markets such as crypto. The transition from positive to negative net issuance (or vice versa) creates uncertainty about structural support. That uncertainty shows up as:
Widening spreads
Increased volatility
Repositioning flows
The “Net Issuance Flip”: Trading the Convergence of Burn and Issuance
Watch for acceleration or deceleration in net issuance, not static levels. Treat shifts from positive to negative net issuance (or vice versa) as volatility triggers. Combine with price compression setups. Regime shifts often precede range expansion. Markets move hardest at turning points, not during steady states. When you see burn rates accelerating while issuance remains flat, you're watching supply compression in real time. When you see burn rates declining while issuance continues, you're watching supply expansion. The traders who catch these inflection points early position themselves before the crowd reacts.
Compare Daily Burn to Daily Trading Volume
A more tactical metric is burn relative to liquidity. If daily ETH burn represents a meaningful percentage of exchange inflows or average daily trading volume, supply compression becomes tradable. If burn is negligible relative to volume, it is unlikely to drive short-term price mechanics. Estimate burn as a share of daily spot volume. If burn meaningfully offsets new issuance relative to market liquidity, supply pressure tightens. If burn becomes trivial relative to liquidity, treat ETH as structurally neutral or inflationary.
The Liquidity-to-Burn Ratio (LBR)
This shifts tokenomics from a narrative metric to a liquidity ratio. You're no longer asking whether ETH is deflationary. You're asking whether deflationary pressures are large enough to move prices, given current liquidity conditions. That's a different question, and it produces different answers depending on market depth.
During periods of high volatility, even small supply shifts can trigger outsized price reactions as liquidity thins.
During stable periods, larger supply shifts may barely register because depth absorbs them.
Context determines whether tokenomics translate into tradable setups.
Track Exchange Balances Alongside Staking
Staking reduces float, but what matters for price is exchange supply, not just total staked ETH. Historical data shows that declining exchange balances often correlate with bullish structural setups, while rising balances increase near-term sell risk. Monitor ETH exchange inflows during periods of declining burn.
If staking slows and exchange balances rise simultaneously, the risk of supply expansion increases.
If staking grows and exchange balances fall, float compression strengthens.
Tokenomics only impacts price when it affects tradable supply. Total staked ETH indicates network security. Exchange balances tell you about available sell-side liquidity. The second metric matters more for short-term positioning.
The “Liquid Float” vs. Exchange Balances: Spotting the True Supply Floor
When exchange balances drop below historical averages while burn accelerates, you're seeing structural tightening in the most liquid part of the market. That setup often precedes sustained rallies because there's simply less ETH available to sell into demand. When exchange balances rise while burn slows, you're seeing the opposite. More supply is entering the market just as structural support weakens.
Align Leverage With Supply Compression Cycles
Perpetual futures markets amplify supply shifts. Funding rate extremes often cluster when burn accelerates, and spot demand rises. Supply tightens, and traders crowd long exposure. Conversely, inflationary regimes with weak burn often coincide with neutral or negative funding and lower conviction. Use lower leverage during supply expansion phases. Increase exposure when supply compression aligns with bullish macro conditions. Avoid aggressive long bias when issuance expands, and on-chain demand weakens.
The “Leverage-Supply” Divergence
Leverage punishes regime misreads more than direction mistakes. You can be right about trend direction but wrong about timing if you don't account for supply dynamics.
High leverage during supply expansion phases means you're fighting against structural headwinds.
Lower leverage during supply compression phases means you're leaving edge on the table.
The traders who adjust position sizing based on supply regimes outperform those who maintain static risk parameters.
When supply tightens, volatility tends to rise.
When supply is expanding, volatility tends to grind sideways or break downward.
Your leverage should reflect the trading regime you're using.
The “Leverage-Supply” Divergence
Most traders treat leverage as a function of conviction or account size. They're not adjusting it based on whether supply dynamics are working for them or against them. That's a structural blind spot. Buy Crypto from Bullpen helps traders align execution with these supply cycles by offering real-time onchain data feeds and position management tools that respond to tokenomic shifts, not just price action.
The Real Edge
Ethereum tokenomics is not about memorizing how much ETH has been burned since 2021. It's about identifying when supply is tightening relative to liquidity. When supply is expanding while demand is weak. When staking and exchange balances change, the float. When regime shifts align with macro momentum.
The “Net Issuance Flip” and Supply Gaps
The traders who outperform are not the ones repeating “ultrasound money.” They're the ones watching when burn accelerates relative to volume, when exchange balances drop during high-activity periods, when validator exits spike during weakness. They're trading the mechanics, not the meme. But knowing when to act is only half the equation. The other half is an execution infrastructure that responds as quickly as the data.
How Bullpen Helps You Trade ETH Tokenomics in Real Time
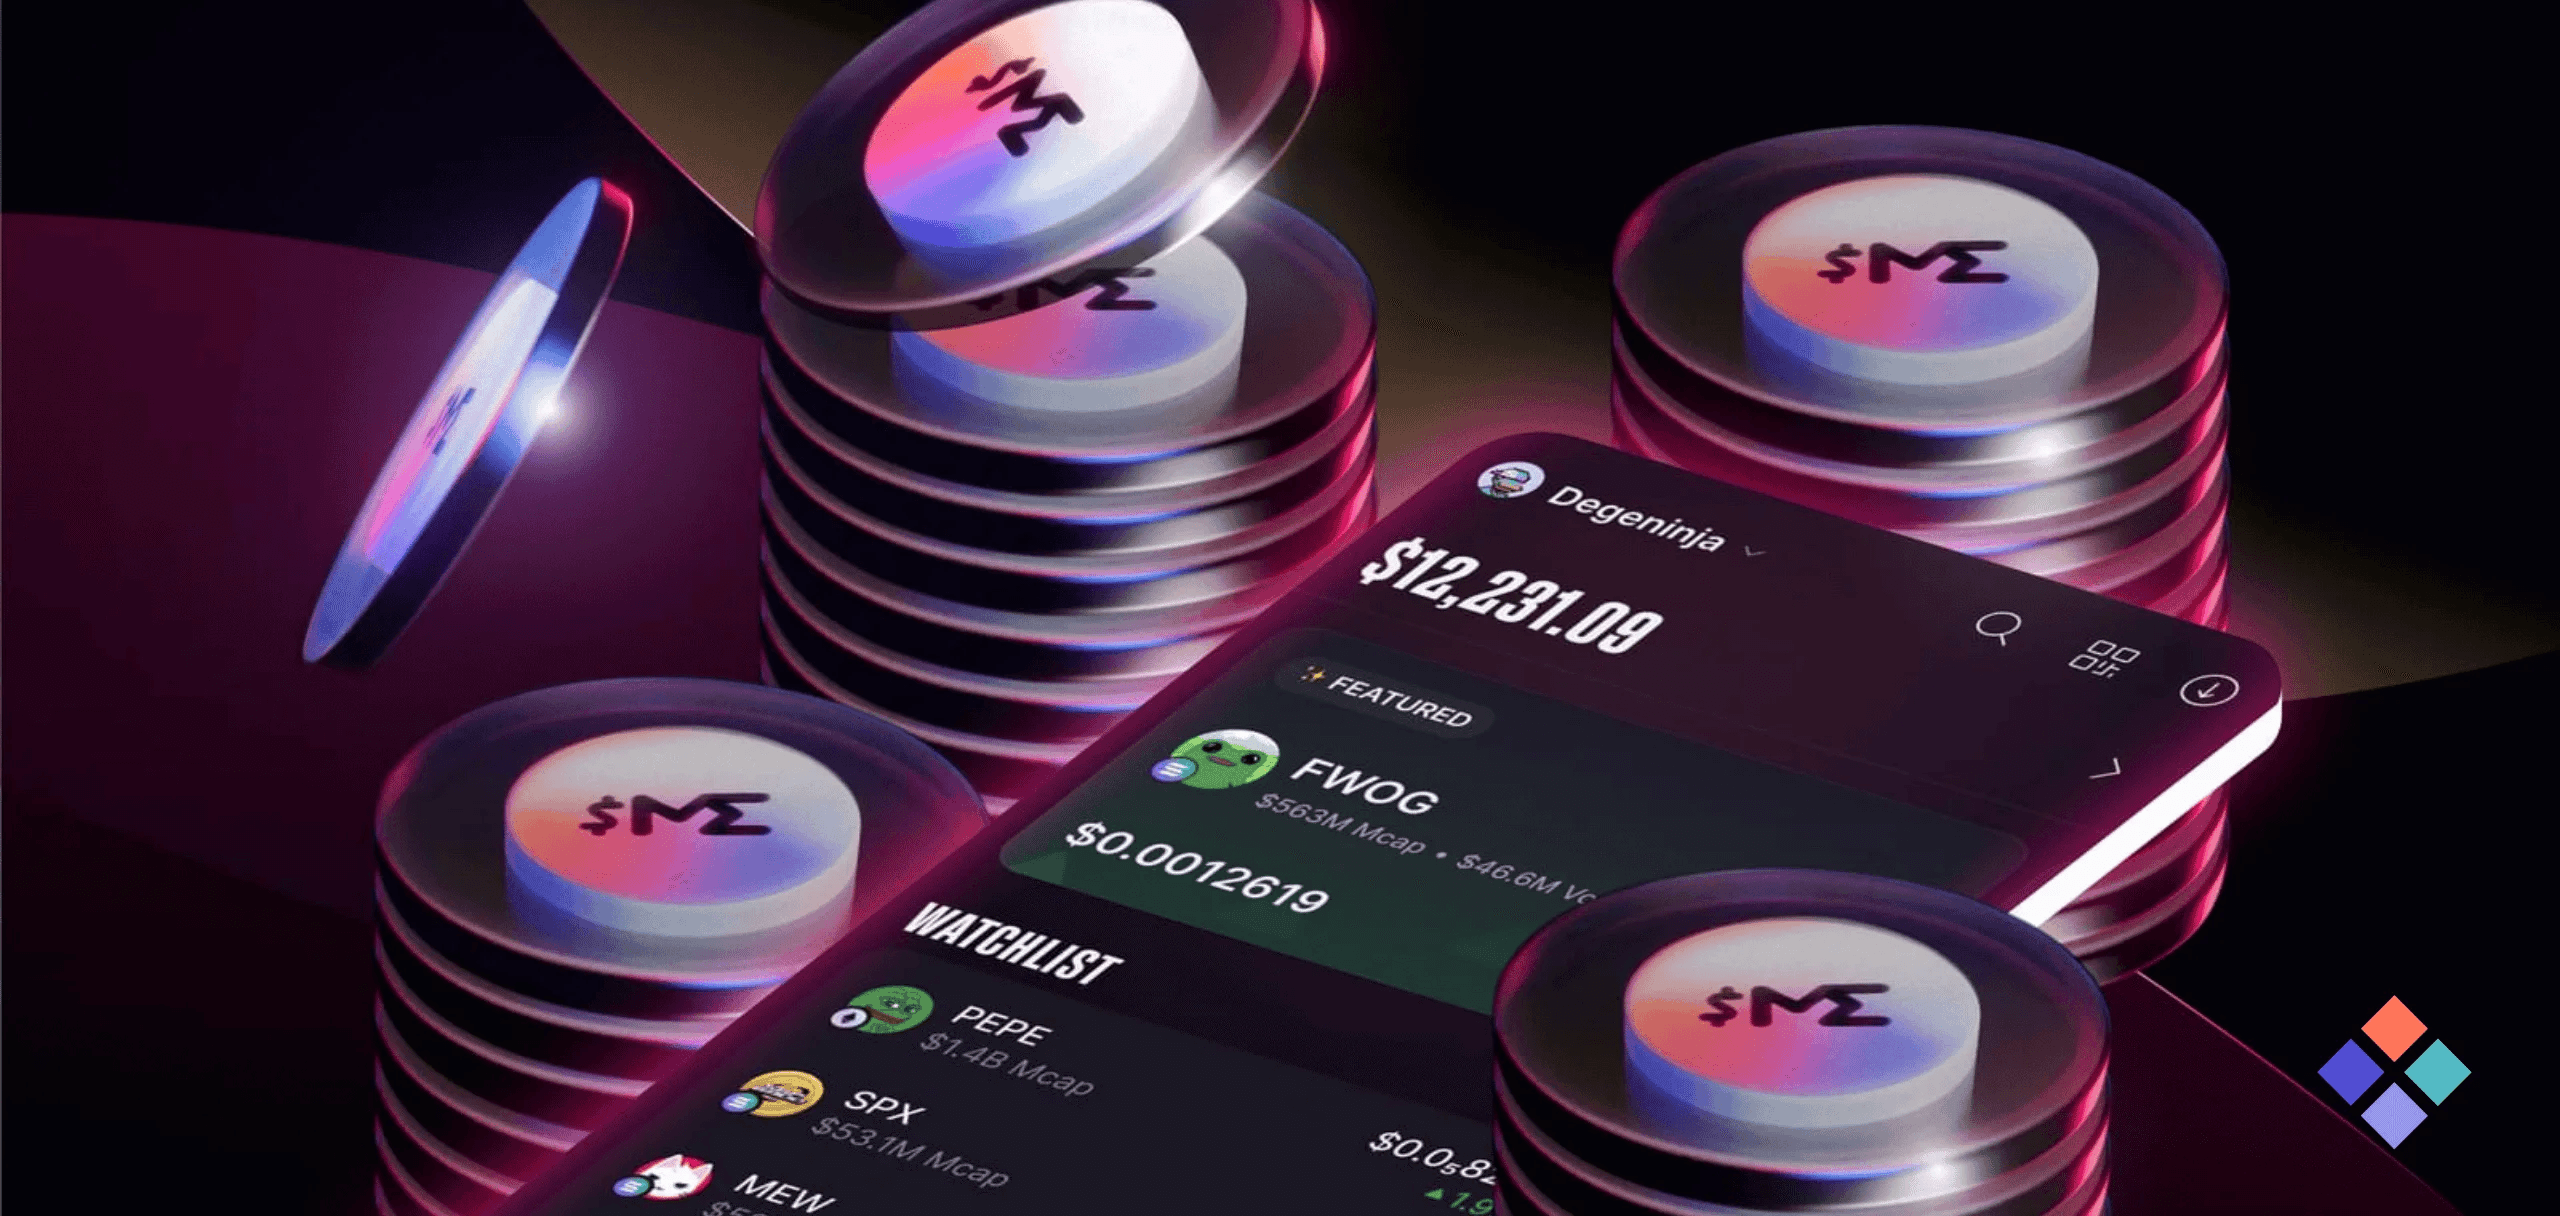
Understanding Ethereum's tokenomics is one thing. Acting on it fast enough is another. Burn spikes, issuance shifts, staking changes, macro catalysts. When these variables align, ETH volatility moves quickly. If your capital is split across wallets, exchanges, and bridges, you're reacting late. Bullpen is built to remove that friction.
Trade ETH Spot and Perps in One App
When supply compression or expansion shifts volatility, you don't want to move funds between exchanges, bridge assets, or miss entries while waiting for confirmations. With Bullpen, you can trade ETH spot and perpetuals in one place. When burn accelerates, or issuance expands, you adjust instantly. If supply tightens and momentum builds, you express that view directly. If supply expands into weak demand, you hedge or flip bias without operational delay. Execution speed matters when regime shifts hit.
Use Leverage When Issuance Shifts Drive Volatility
Ethereum's supply mechanics often amplify volatility during inflection points. When burn accelerates during high-activity periods, upside-down squeezes can intensify. When issuance outpaces burn in quiet markets, downside pressure builds gradually. Bullpen allows you to use leverage strategically when these shifts occur, not days later. Leverage should follow structural context, not emotion. Having it available in the same interface reduces hesitation.
Follow Traders With Verified PNLs
Tokenomics signals are structural, but positioning still matters. Instead of guessing how the market is interpreting supply shifts, Bullpen lets you follow traders with:
Verified PNLs
View a live leaderboard
See who is actually profitable
If experienced traders begin positioning aggressively around burn acceleration or macro plus issuance alignment, you see it in real time. No relying on anonymous calls. No trusting screenshots. Just performance-backed transparency.
Get Notified When Top Performers Open ETH Positions
When ETH volatility spikes, reaction time matters. Bullpen sends notifications when high-performing traders open positions. That gives you immediate insight into how experienced participants are responding to changing supply dynamics. Instead of scrolling through social media to interpret sentiment, you see positioning directly.
Buy ETH With Apple Pay or Your Bank Account
If tokenomics shifts create opportunity and you need capital deployed fast, Bullpen removes friction. You can buy ETH with Apple Pay, fund with your bank account, and deploy without juggling platforms. No fragmented capital. No delays.
Mapping Back to the Real Problem
Earlier, we identified the core risk: Ethereum's supply is dynamic. Burn fluctuates. Issuance shifts. Staking affects float. If you understand those mechanics but can't execute quickly, the insight loses value. Bullpen solves that execution gap. No switching apps to react to burn spikes. No fragmented capital when volatility hits. No guessing who's profitable. You see verified performance live. If you're tracking ETH tokenomics but still trading slowly, you're leaving edge on the table.
Related Reading
Buy Crypto Today with Bullpen
If you're trading ETH without tracking supply dynamics, you're missing half the picture. Deposit on Bullpen today to earn a 500-point bonus, and get a free introductory call when you deposit $1,000 or more. Trade Ethereum smarter, faster, and all in one place.
Last Updated:
March 23, 2026