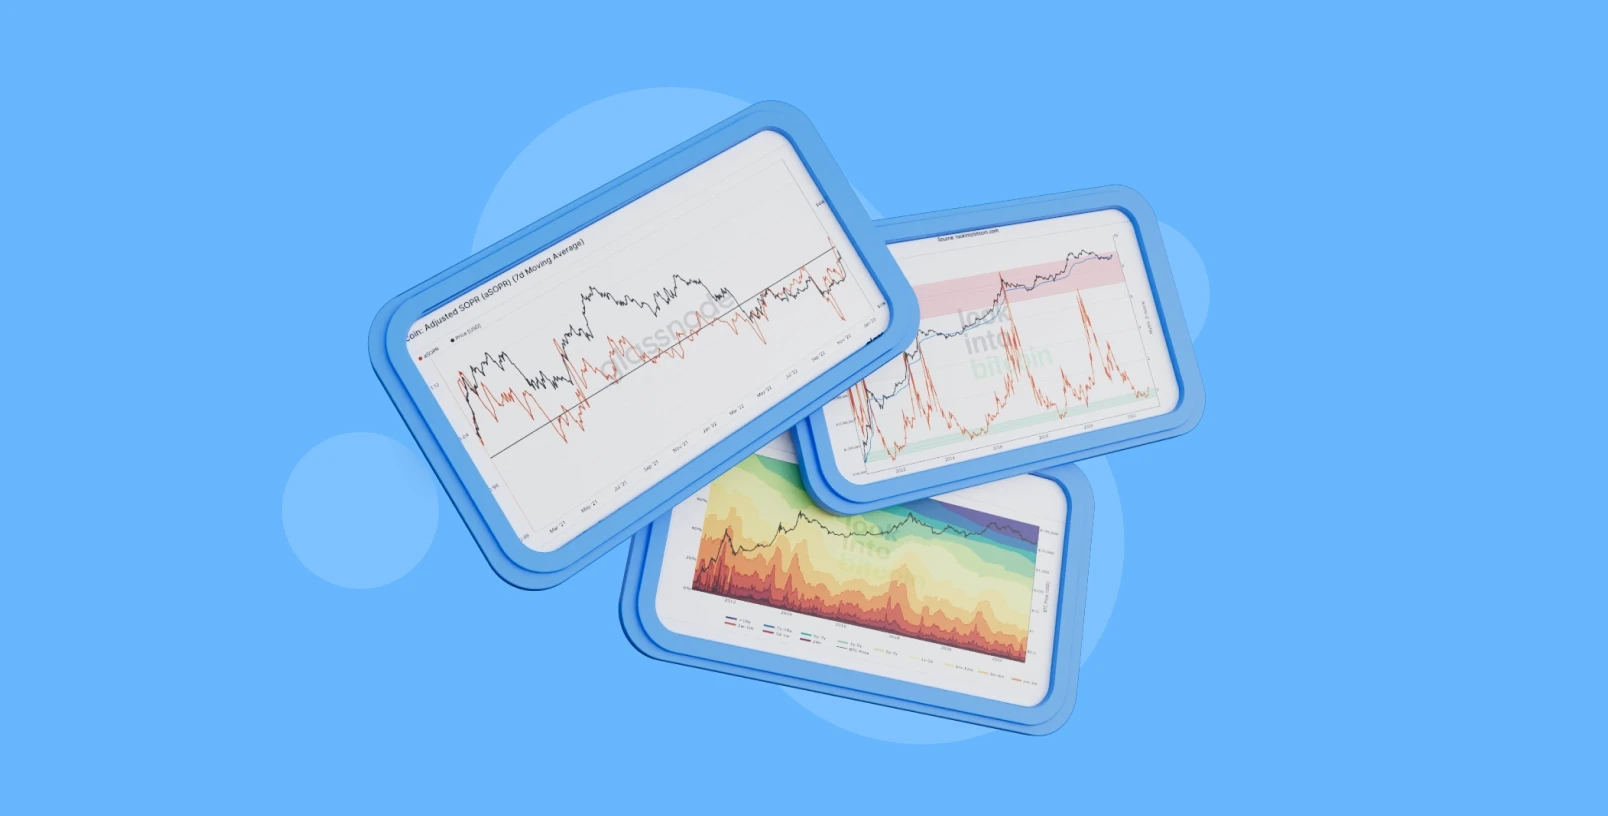
Get deep insights into blockchain data. Our on-chain analysis identifies market cycles and investor behavior to help you trade with confidence.
Ever wonder why some traders seem to know exactly when to enter the “Best Memecoins” before they explode, while others are left buying the top? The answer lies in on-chain analysis, a method that reveals wallet movements, transaction patterns, and blockchain data that traditional charts simply can't show. This article will teach you how to read these digital footprints, understand what smart money is doing behind the scenes, and use transaction data to make informed decisions instead of gambling on hype.
Once you understand the signals hidden in blockchain metrics such as token flows, whale activity, and liquidity patterns, the next step is to take action. Bullpen's buy Crypto platform gives you the tools to act on your on-chain insights quickly, letting you track emerging opportunities and execute trades when the data points to potential gains.
Summary
On-chain analysis shows you wallet movements, transaction patterns, and blockchain data that price charts miss entirely. When you see a rally or consolidation on a chart, you're looking at the result of capital flows and whale behavior that may have started hours or days earlier.
Over 70% of Bitcoin's supply hasn't moved in over a year, according to January 2025 data, signaling that long-term holders are maintaining conviction despite price swings. That kind of positioning doesn't show up in candlestick patterns or technical indicators. It shows up in wallet behavior, transfer volume, and exchange flow data.
Raw blockchain data is public but not simple. Bitcoin has processed over one billion transactions since launch, with hundreds of thousands added daily during high activity periods. Each transaction generates dozens of variables, including wallet addresses, timestamps, gas fees, and contract interactions.
On-chain data reveals behavior, not guaranteed outcomes. A large wallet transfer shows movement, not motive. Exchange inflows signal potential pressure, not certainty. The same signal that preceded a rally last month might precede nothing this week or trigger a sharp reversal instead.
Effective on-chain analysis tracks who is positioning capital, where it's moving, and what that behavior suggests about future supply dynamics. The edge emerges when multiple signals align across different data types. Declining exchange balances, rising stablecoin reserves, and strong long-term holder retention together suggest constrained supply and potential buying power.
Execution speed determines whether you capture opportunities or watch them dissolve. Most traders fragment their workflow across four or five platforms, with one tab for whale tracking, another for exchange flows, a third for execution, and a fourth for funding. That context switching creates lag between signal detection and action.
Buy Crypto from Bullpen to consolidate discovery and execution into a single interface, surfacing whale movements, liquidity shifts, and verified performance data alongside trading tools, so traders can act while signals still carry weight rather than arriving after the opportunity has shifted.
Table of Contents
Why Price Charts Alone Don’t Tell the Full Story in Crypto

Price charts capture outcomes, not the forces that create them. When you see a spike or a consolidation pattern, you're looking at the result of capital flows, leverage positioning, and wallet behavior that may have started hours or even days earlier. The chart shows you what happened. It doesn't explain why or what's likely next. Technical analysis has value. Patterns, support levels, and momentum indicators help traders frame risk and identify potential entry points. But in Crypto, where markets run 24/7 and a single large wallet can move prices before any pattern completes, relying solely on chart structure leaves you reacting instead of anticipating.
The Gap Between Price And Cause
A sudden rally might look identical on a chart, whether it's driven by sustained accumulation from long-term holders or a cascade of short liquidations. Both create upward price movement. Both might trigger the same technical buy signals. Yet one suggests growing conviction, while the other reflects forced covering that could reverse quickly. Without visibility into what's happening beneath the surface, you're trading blind. You see the movement, but you can't distinguish between real demand and mechanical pressure. That gap matters, especially when volatility accelerates, and decisions must be made in minutes, not hours.
Whale Activity Moves Markets Before Patterns Form
Large holders operate differently from retail traders. They don't wait for breakouts or moving average crosses. They position ahead of those signals, often accumulating quietly during periods of low volatility or distributing into strength when charts look most bullish.
On-Chain vs. Technical Analysis: Bridging the Information Gap
Bitcoin Magazine Pro noted in January 2025 that over 70% of Bitcoin's supply hasn't moved in over a year, a sign that long-term holders are holding firm despite price swings. That kind of conviction doesn't show up in candlestick patterns.
It shows up in:
Wallet behavior
Transfer volume
Exchange flow data
By the time the chart reflects that conviction through a sustained rally, the opportunity to position early has often passed.
Exchange Net Flow: The Lead Indicator for Market Volatility
Whales also move liquidity in ways that distort technical signals. A large transfer to an exchange may precede selling pressure, but the chart won't show that intent until the sell orders are executed. Accumulation of exchanges can occur quietly, with prices remaining flat or even drifting lower while smart money builds positions.
Leverage Amplifies Distortion
Crypto markets are heavily influenced by leverage. When prices move sharply in one direction, liquidations can trigger cascading effects unrelated to underlying demand. A long squeeze can push prices down rapidly, liquidating overleveraged positions and creating the appearance of a breakdown. A short squeeze can do the opposite, spiking prices upward as shorts scramble to cover. These moves often appear on charts as strong directional signals. Indicators might confirm the trend. Volume might spike. But the move is mechanical, driven by forced liquidations rather than genuine buying or selling interest. Once the cascade completes, price can reverse just as quickly, leaving traders who followed the chart signal caught on the wrong side.
Sideways Action Hides Opposing Forces
Consolidation periods are particularly deceptive. When the price moves sideways, technical traders often interpret it as a sign of indecision or equilibrium. But blockchain data can reveal whether that consolidation represents accumulation by informed participants or distribution by those looking to exit. Quiet buying during consolidation often precedes moves upward. Quiet selling into strength can precede declines. From the chart alone, the two scenarios appear nearly identical. The difference only becomes clear when you track:
Wallet behavior
Exchange inflows
Large holder positioning
Speed And Timing Create Blind Spots
Crypto markets don't sleep. News breaks across time zones. Transfers happen instantly. A large wallet movement in Asia can trigger volatility before European or American traders even wake up. By the time the chart shows a breakout or breakdown, the initial move may already be exhausted. Traditional technical analysis assumes you can spot a pattern forming and act before it completes. In Crypto, the speed of information flow and execution often means the move is already underway before the pattern is visible. That lag creates risk, especially for traders relying exclusively on historical price data.
Workflow Optimization: The Hidden Cost of Context Switching
Most trading platforms fragment this information. You check charts on one tool, monitor whale wallets on another, track exchange flows somewhere else, and try to synthesize it all in real time. The friction slows you down. Buy Crypto from Bullpen to consolidate execution and discovery into a single interface, surfacing whale movements, liquidity shifts, and verified performance data alongside your trading tools, so you're not piecing together incomplete information as prices move.
The Limitation Isn't The Chart, It's The Context
Charts remain useful. They show you where price has been, where resistance and support might lie, and how momentum is building or fading. But they're incomplete without the context that blockchain data provides.
Market Mechanics: The Convergence of Sentiment and Statistics
When you combine price action with wallet flows, exchange activity, and holder behavior, you start to see the mechanics behind the movement.
You can distinguish between real accumulation and short covering.
You can spot distribution before it shows up as a breakdown.
You can identify when leverage is about to unwind and when quiet buying is setting up the next leg higher.
The question isn't whether to use charts. It's whether you're willing to trade with only half the information when the other half is sitting on the blockchain, waiting to be read.
Related Reading
The Hidden Complexity Behind Blockchain Data
Raw blockchain data is publicly available, but it's not straightforward. Every transaction generates dozens of variables, including:
Wallet addresses
Timestamps
Gas fees
Contract interactions
Parsing that flood of data into actionable insights requires more than curiosity. It requires infrastructure, context, and the ability to separate signal from noise faster than markets move.
Scale Overwhelms Manual Analysis
The numbers alone create friction. According to Blockchain.com, Bitcoin has processed over one billion transactions since its launch, with hundreds of thousands added daily during periods of high activity. Ethereum, which powers smart contracts and decentralized applications, handles even more complexity. Each transaction isn't just a transfer of value. It's a record of sender behavior, receiver identity, contract execution, fee structure, and timing, all of which shift meaning depending on market conditions.
Cross-Chain Fragmentation: Tracking the Multi-Chain Money Trail
That volume expands further when you account for:
Layer 2 networks
Sidechains
Transactions fragment across protocols, each with different data structures and reporting standards. Tracking a single large holder might require monitoring activity across:
Multiple blockchains
Wallets
Contract interactions simultaneously
Pseudonymity Hides Intent
Wallet addresses don't come with names attached. A single entity can control:
Thousands of addresses
Splitting holdings to obscure size
Avoid detection
Exchanges hold billions in assets across omnibus wallets, mixing funds from millions of users. Without clustering techniques and historical pattern recognition, distinguishing between a whale accumulating and an exchange rebalancing custody becomes nearly impossible.
Address Clustering and Heuristics: Mapping the Real-World Entities
Research from Chainalysis shows that a small number of entities control disproportionate shares of on-chain activity, but identifying them requires sophisticated analytics that go far beyond checking a block explorer. You need to trace relationships between addresses, track fund flows over time, and correlate behavior with price movements to understand who's actually moving markets.
Exchange Flows Mislead Without Context
A large deposit at an exchange signals selling pressure. Sometimes it is.
Other times, it's an:
Internal transfer
Collateral for derivatives trading
A custody shift with no intent to sell
The transaction itself is identical. The meaning depends entirely on what happens next, and by the time that becomes clear, the market may have already reacted.
Analyzing Intent: Distinguishing Between HODLing and Liquidity Provision
Outflows present the same ambiguity. Withdrawals from exchanges are often interpreted as bullish, suggesting holders are moving assets into cold storage for long-term holding. But those same withdrawals could represent OTC trades, staking operations, or liquidity provision on decentralized platforms. Without tracking the destination and subsequent activity, the signal remains incomplete.
Smart Contract Interactions Multiply Complexity
Decentralized finance protocols generate millions of interactions daily. Lending, borrowing, liquidity provision, yield farming, and token swaps each create distinct on-chain footprints. A single user might execute dozens of transactions in a session, each touching multiple contracts and generating data that looks different depending on which protocol you're analyzing.
The Signal in the Noise: Distinguishing Organic Growth from MEV and Arbitrage
According to Dune Analytics, large DeFi protocols process tens of thousands of interactions per day, with transaction counts spiking during periods of volatility or new token launches.
Interpreting that activity requires:
Understanding protocol mechanics
Fee structures
How different contracts interact
A spike in Uniswap volume might signal organic demand, or it might reflect arbitrage bots exploiting price discrepancies across exchanges.
Network Metrics Require Interpretation
Rising transaction counts sound bullish. Sometimes they are. At other times, they reflect spam, automated trading, or NFT minting waves unrelated to underlying adoption. High gas fees on Ethereum have historically correlated with speculative frenzies, not sustainable growth. Coin Metrics reports that fee spikes often precede corrections, as retail participants chase late-stage moves while informed holders quietly exit.
Sybil Detection and the Challenge of Economic Significance
Active addresses tell a similar story. Growth in unique wallets can signal either an expanding user base or a single actor creating thousands of addresses to manipulate perception. Without filtering for meaningful economic activity, raw metrics become noise.
Time Pressure Compounds Every Challenge
Crypto markets don't pause. A whale movement in Tokyo can trigger volatility before New York wakes up.
By the time you manually piece together wallet flows:
Exchange activity and contract interactions
The opportunity has passed
The risk has materialized
Speed matters, but speed without accuracy creates worse outcomes than waiting.
The Cost of Decision Latency: Minimizing the ‘Missing Half-Second’ in Volatile Markets
Most traders cobble together data from multiple sources.
One platform for charts
Another for whale tracking
A third for exchange flows
A fourth for DeFi activity
Friction slows decision-making and increases the risk of missing critical signals. Buy Crypto from Bullpen consolidates execution and discovery into:
A unified interface
Surfacing whale movements
Liquidity shifts
Verified performance data alongside trading tools
That integration compresses the time between signal detection and action, eliminating the context-switching that creates blind spots during volatile periods.
The Real Barrier Isn't Access, It's Synthesis
Blockchain transparency gives you visibility. It doesn't give you understanding. The difference between seeing a transaction and knowing what it means is the difference between data and intelligence. Public ledgers expose every move, but without the tools to filter, cluster, and contextualize that information in real time, you're drowning in detail while missing the pattern. But even with the right tools and context, a dangerous assumption persists: that data alone can predict what comes next.
The Myth: On-Chain Data Predicts Price Automatically
On-chain data reveals behavior. It doesn't guarantee outcomes. A large wallet transfer shows you movement, not motive. Exchange inflows signal potential pressure, not certainty. The gap between observation and prediction is where most traders lose money, mistaking visibility for foresight. The confusion makes sense. Blockchain transparency creates an illusion of control. If you can see every transaction, track every whale, monitor every exchange flow, surely you can predict what happens next. But markets absorb information asymmetrically. The same signal that preceded a rally last month might precede nothing this week, or worse, a sharp reversal.
Why Success Stories Mislead
Viral posts amplify the myth. Someone highlights a massive transfer to Binance that happened two hours before Bitcoin dropped 8%. The implication feels clear: follow the whales, predict the crash. What you don't see are the dozens of similar transfers from the same week that went nowhere. Selection bias makes patterns appear clearer in hindsight than they ever were in real time.
The Confluence of Context: Why On-Chain Data Needs a Market Lens
According to Glassnode's January 2025 analysis, exchange inflows during strong uptrends are often absorbed without triggering selloffs, whereas similar flows during fragile conditions can accelerate declines. The data point itself carries no inherent meaning.
Context determines everything:
Liquidity depth
Open interest in derivatives
Sentiment
Macro conditions
Strip away that context, and you're reading tea leaves.
Signal vs. Noise: Deconstructing Internal Transactions and Operational Flows
Analytics platforms contribute to the confusion by packaging whale alerts as actionable intelligence. A notification pings: "Whale moved 5,000 BTC." Your heart rate spikes. You open your trading interface, ready to act. The transfer may indicate custody rebalancing between cold wallets, collateral for an OTC trade, or an exchange consolidating user funds. Chainalysis research shows that a significant portion of large movements involves institutional operations with zero directional intent.
When Hindsight Distorts Reality
After a price move, analysts reverse-engineer explanations. They scan on-chain data for signals that “predicted” the outcome. A spike in active addresses before a rally becomes proof that network activity drives price. But correlation isn't causation, and retrospective analysis ignores all the times similar activity preceded nothing.
The Hindsight Trap: Why the Human Brain Overestimates On-Chain Signals
Behavioral finance research documents this pattern across markets. Humans construct narratives after events occur, overstating how predictable those events were beforehand. In Crypto, where data flows constantly, and prices move violently, the temptation to find patterns intensifies. The problem isn't the data. It's the assumption that historical correlation equals future prediction. I've watched traders build entire strategies around whale tracking, convinced they've found an edge.
They monitor:
Specific addresses
Set alerts for large movements
Position themselves ahead of what they believe comes next
Sometimes it works. More often, they're reacting to noise, chasing signals that don't carry the weight they assume.
The Derivatives Layer Complicates Everything
On-chain data captures spot market activity.
It misses:
The leverage is building in perpetual futures
The open interest is stacking up on exchanges
The funding rates signal an imbalance
According to Coinglass, liquidation cascades frequently drive price moves independent of spot flows. A long squeeze can drive prices downward, even as on-chain data shows quiet accumulation. A short squeeze can spike the price upward while whales quietly distribute into strength.
Cognitive Load and Decision Fatigue: The Hidden Cost of Tool Fragmentation
Most traders fragment their attention across multiple tools.
One tab for whale tracking
Another for exchange flows
A third for liquidation data
A fourth for charts
The friction creates lag. By the time you synthesize information from four sources, the opportunity has shifted, or the risk has materialized. Buy Crypto from Bullpen to compress that workflow, surfacing whale movements, liquidity shifts, and derivatives positioning in one interface alongside execution tools. The edge isn't just seeing the data. It's seeing it fast enough to act while the signal still matters.
Same Data, Opposite Conclusions
Rising exchange balances might signal distribution as holders prepare to sell. Or it might reflect traders moving funds to capitalize on funding rate arbitrage. Declining balances could mean accumulation into cold storage, or simply users rotating into DeFi protocols for yield. Without understanding market structure and participant behavior, the same metric supports contradictory narratives. This ambiguity doesn't make on-chain data useless. It makes naive interpretation dangerous. A whale buying 10,000 ETH matters differently during a sustained downtrend than during a parabolic rally. Context transforms data from observation into insight. Strip away that context, and you're guessing with extra steps.
The Real Value Isn't Prediction
On-chain analysis works when you stop expecting it to predict prices automatically and use it to understand who's doing what beneath the surface.
Large holders accumulating during a quiet consolidation indicate conviction.
Exchange outflows accelerating during a rally suggest holders expect further upside.
Stablecoin inflows to exchanges signal dry powder waiting to deploy.
The Confluence of Analysis: Stacking Probabilities for High-Conviction Trades
None of these guarantees the next move. They provide clues about positioning, sentiment, and capital flows that, when combined with price action, derivatives data, and broader market conditions, inform decisions. The edge comes from synthesis, not observation. You're not predicting the future. You're reading the present more clearly than traders relying on price alone. But knowing what to look for and actually executing on that knowledge are entirely different challenges.
Related Reading
What Effective On-Chain Analysis Actually Looks Like
Effective on-chain analysis starts with a question: who is positioning capital, where is it moving, and what does that behavior suggest about future supply dynamics? The goal isn't to predict price directly. It maps the intentions and constraints of market participants by tracking flows over time and synthesizing those patterns with market structure and execution timing.
Beyond Individual Wallets: Deciphering the Logic of Entity Clusters
Professional analysts focus on behavioral clusters, not isolated transactions. A single whale transfer means little without understanding whether it's part of:
Sustained accumulation
Custody rebalancing
Preparation for distribution
The edge emerges when multiple signals align across different data types, creating a clearer picture of market conditions than any single metric could provide.
Exchange Flow Patterns Reveal Supply Pressure
Assets moving to exchanges often signal potential selling pressure, while withdrawals to private wallets suggest accumulation or long-term holding. But the interpretation depends entirely on context.
During strong uptrends, exchange inflows frequently get absorbed without triggering selloffs.
During fragile conditions, identical flows can accelerate declines.
Illiquid Supply Dynamics: The Mechanics of the Supply Squeeze
Sustained exchange outflows have historically coincided with periods of reduced liquid supply, which can support upward price trends when demand remains steady. The keyword is sustained. A single day of outflows tells you almost nothing. A month-long pattern of declining exchange balances, while prices consolidate, suggests holders expect further upside and are removing supply from circulation.
Long-Term Holder Conviction Signals Cycle Transitions
Coins that haven't moved for extended periods are considered “strong hands.” When these holders begin transferring assets, it indicates a change in conviction about future price direction. Shifts in dormant supply, coins inactive for months or years, often occur around major market cycle transitions.
Cross-Chain Flow Attribution: Connecting the Dots in a Multi-Chain World
According to Nansen, their analytics platform focuses on three core pillars:
Real-time alerts
Historical pattern recognition
That framework reflects what matters most in holder analysis.
You need to know when behavior changes
How it compares to past cycles
Whether similar patterns are emerging across multiple assets simultaneously
The challenge is distinguishing between holders rotating portfolios and holders exiting positions entirely. A long-term Bitcoin holder moving coins might be diversifying into altcoins rather than selling for fiat. Without tracking the destination and subsequent activity, the signal remains incomplete.
Whale Concentration Shapes Liquidity Conditions
Large entities control substantial liquidity and can influence market conditions through their allocation decisions. Gate.io's analysis notes that monitoring the top 100 wallets provides insight into how concentrated ownership affects price stability and volatility patterns. When whales accumulate during quiet periods, they're often positioning ahead of moves that retail participants won't recognize until momentum becomes obvious.
Forensic Filtering: Distinguishing Omnibus Noise from Directional Alpha
But whale tracking requires filtering out noise. Exchanges hold billions across omnibus wallets. Custody providers manage assets for multiple clients. A single large transfer may simply reflect internal rebalancing. The meaningful signals come from wallets with consistent directional behavior over weeks or months, not one-off movements that could mean anything.
Network Activity Separates Speculation From Adoption
Rising active addresses, transaction counts, or fee revenue can signal growing demand for block space and underlying utility. Sustained increases in on-chain activity often accompany ecosystem expansion. Short-term spikes frequently reflect speculative bursts rather than durable adoption.
Signals of Sustainability: Distinguishing Hype Spikes from Organic Adoption
During NFT minting frenzies, Ethereum gas fees spiked to levels that priced out normal users. Transaction counts surged. Active addresses multiplied. Yet much of that activity evaporated within weeks, leaving behind congested networks and frustrated participants. Real adoption shows up as consistent growth in economically meaningful transactions, not temporary volume spikes driven by hype cycles.
Stablecoin Positioning Indicates Deployment Readiness
Stablecoins serve as trading capital in Crypto markets. Increases in supply or movement toward exchanges indicate readiness to deploy funds. Surges in stablecoin balances on exchanges often precede periods of elevated trading activity, as that capital represents dry powder waiting for opportunities. The inverse matters too. When stablecoin balances decline while prices rally, it suggests buyers are converting fiat-pegged assets into volatile tokens, potentially exhausting near-term demand. If prices continue to rise while stablecoin reserves decline, the move becomes more vulnerable to a reversal once those reserves are depleted.
The Science of Execution Lag: How Cognitive Load Drains Your Edge
Most traders fragment this workflow across multiple platforms. One tool for exchange flows, another for whale tracking, a third for stablecoin monitoring, a fourth for network metrics. The friction creates a lag between signal detection and action. Buy Crypto from Bullpen to consolidate discovery and execution into one interface:
Surfacing whale movements
Liquidity shifts
Verified performance data alongside trading tools
That compression eliminates the context-switching that creates blind spots during volatile periods, helping traders act while signals still carry weight.
Signal Alignment Creates Conviction
Individually, each metric is incomplete. Exchange inflows might reflect selling or collateral transfers. Whale movements could represent portfolio rebalancing rather than directional bets. Network activity may originate from bots rather than users. The edge emerges when signals align. Declining exchange balances, rising stablecoin reserves, and strong long-term holder retention together suggest constrained supply and potential buying power. That combination has historically preceded bullish conditions. Rising exchange inflows, coupled with weakening holder conviction and declining stablecoin balances, may signal a distribution.
The Execution Mindset: Closing the Gap Between Analysis and Action
Effective analysis is more closely aligned with behavioral intelligence than with technical pattern recognition. You're attempting to understand who's doing what beneath the surface, then asking whether supply is tightening or loosening relative to demand. When combined with market context and execution capability, that insight provides a meaningful strategic advantage.
Why Acting on On-Chain Insights Is Hard in Practice

Spotting a signal and capturing the opportunity are separated by infrastructure friction. Crypto markets reward speed, but the tools most traders rely on introduce delay at every step. You might identify accumulation patterns or whale movements early, yet by the time you've navigated wallet transfers, exchange logins, and order placement across fragmented platforms, price has already adjusted. The insight was correct. The execution was too slow.
Data Lives Everywhere Except Where You Need It
Exchange balances appear on one dashboard. Whale alerts are delivered via a separate service. Derivatives metrics sit in a third platform. Price charts occupy yet another tab. Synthesizing these streams while markets move requires constant context switching. You're not just analyzing information. You're hunting for it across disconnected interfaces, each with different refresh rates and notification systems.
The Science of Execution Latency: How Context Switching Erases Your Edge
During volatile periods, that fragmentation becomes paralyzing. A stablecoin inflow signal appears while you're checking liquidation data on another screen. By the time you return to the first platform and confirm the pattern, buying pressure has already materialized. The opportunity was compressed into minutes, while your workflow spanned multiple tools.
Cross-Chain Activity Scatters Attention
Capital no longer concentrates on a single network. According to data compiled by DeFiLlama, billions of dollars are distributed across:
Ethereum
Solana
Arbitrum
Base
Dozens of other chains
A whale might accumulate on Ethereum while deploying leverage on Solana. Tracking that behavior requires monitoring separate block explorers, different wallet standards, and distinct transaction patterns simultaneously.
Liquidity Fragmentation: The Invisible Cost of Multi-Chain Silos
Liquidity shifts across chains create blind spots. A token might show strength on one network while quietly draining on another. Without unified visibility, you're making decisions based on partial information, assuming the slice you're viewing represents the whole picture.
Moving Capital Eats Time You Don't Have
Acting on a signal often requires:
Transferring funds between wallets
Bridging assets across chains
Converting stablecoins before placing orders
Each step introduces latency. Cold storage withdrawals can take several minutes. Bridge transactions require confirmations on both source and destination chains. Exchange deposits need processing time before funds become tradable.
The Custody Latency Tax: Why Cold Storage Can Be Your Biggest Trading Cost
During major market events, those delays compound. When exchange failures trigger liquidation cascades, prices can swing double digits within hours, as documented by historical CoinGecko market data. A trader who identified the opportunity early but needed fifteen minutes to move assets from cold storage and complete exchange deposits often arrives after the sharpest move has already occurred.
Economic Throughput: Calculating the ROI of Gas Competition
Network congestion makes timing worse. Peak activity periods drive Ethereum gas fees to levels that slow smaller traders entirely. According to Etherscan data from past network surges, transaction costs have spiked enough during volatile periods to make certain trades economically unviable. You're not just competing against other traders. You're competing against blockchain capacity constraints.
Execution Workflows Pile Friction On Top Of Analysis
Even within a single exchange, operational steps multiply. Assets might sit in the wrong wallet type. Leverage settings need adjustment. Collateral requires reallocation. Each action requires navigating different sections of the interface while the price continues to move.
Capital Velocity: The Strategic Cost of Operational Latency
Cross-platform workflows introduce more delay. Identifying on-chain accumulation doesn't help if your trading capital is held on a centralized exchange that doesn't list the asset. You'll need to withdraw funds, bridge to the correct network, locate liquidity on a decentralized exchange, and execute the swap. That sequence can take thirty minutes or longer, during which the signal that prompted action may have fully played out.
The Science of Execution Lag: How Cognitive Load Drains Your Edge
Most traders fragment their workflow across four or five platforms.
One tab for whale tracking
Another for exchange flows
A third for liquidation data
A fourth for charts
A fifth for actual execution
Context switching creates a lag between signal detection and action. Buy Crypto from Bullpen and consolidate discovery and execution into one interface, surfacing:
Whale movements
Liquidity shifts
Verified performance data alongside trading tools
That compression eliminates the workflow fragmentation that creates blind spots during volatile periods, helping traders act while signals still carry weight.
Tracking Whales Reveals Incomplete Pictures
On-chain tools identify large wallets, but they rarely show their full positions. Professional traders spread activity across:
Spot holdings
Derivatives contracts
Lending protocols
Off-chain accounts
A whale might accumulate tokens on-chain while simultaneously shorting perpetual futures on a centralized exchange. The blockchain shows buying. The actual position is neutral or even bearish.
Decoding the Shadow: Address Clustering and Algorithmic Order Shredding
Institutional participants obscure activity further by routing trades through multiple addresses and venues. What appears to be distributed retail buying may represent a single entity splitting orders to reduce market impact. Without understanding the full picture, you're reacting to visible flows while missing the strategic intent behind them.
Signals Compress Faster Than Execution Allows
A trader notices large exchange withdrawals, suggesting accumulation. The pattern looks clear. But moving funds from cold storage takes time. Confirming the wallet transfer adds more. Converting stablecoins to the target asset introduces another step. Sizing the position and placing orders requires additional clicks. By the time the order executes, the price may already reflect the accumulation signal that triggered the trade.
Liquidity Staging vs. Capital Deployment: The ‘Dry Powder’ Fallacy
Stablecoin inflows present the same challenge. Observing capital arriving at exchanges indicates buying power, but it doesn't reveal timing. That capital might be deployed immediately or remain idle for days. Acting on the inflow alone means guessing when deployment occurs, often entering too early or too late relative to actual buying activity. The market doesn't wait for you to catch up. Speed matters, but only when paired with accuracy. Rushing through fragmented workflows introduces mistakes. Taking time to execute carefully means arriving too late to capture the opportunity.
How Bullpen Helps You Act on On-Chain Signals Faster
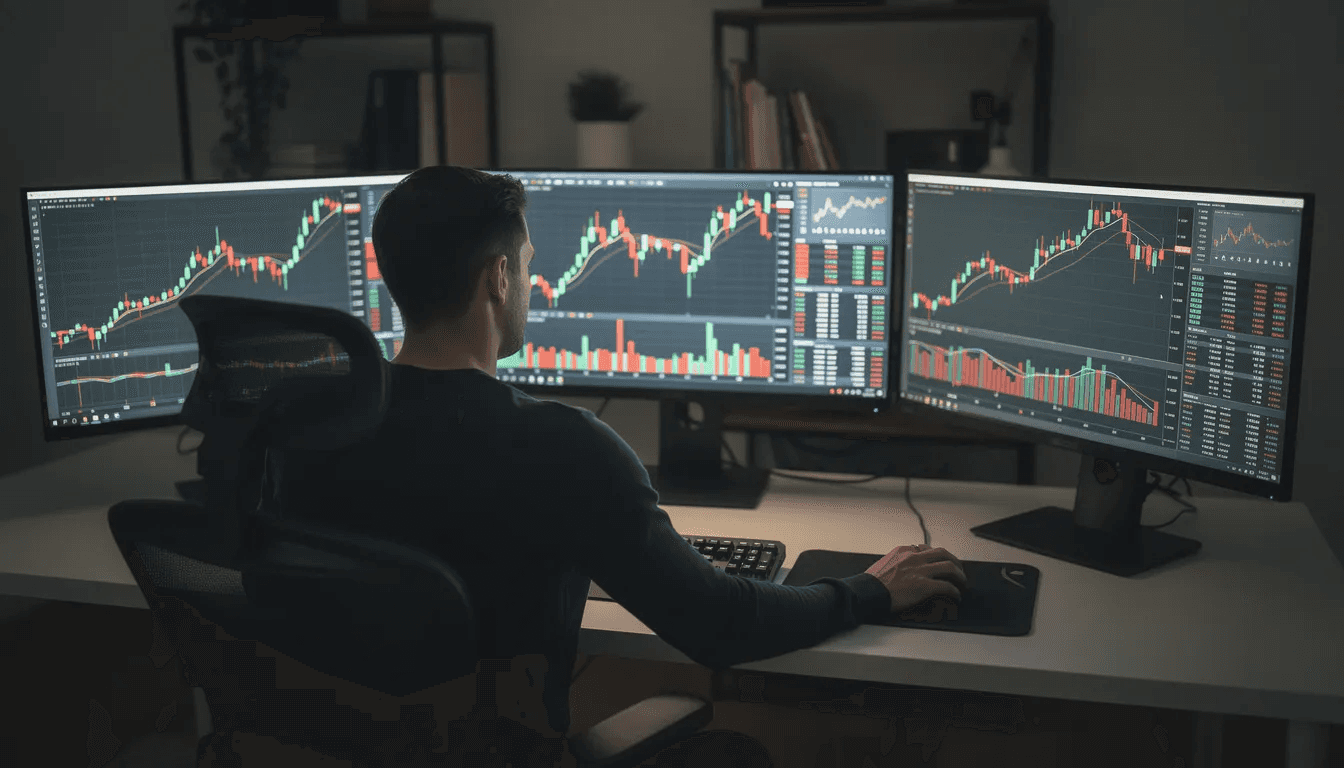
Execution speed determines whether you capture opportunities or watch them dissolve. Bullpen compresses the distance between detecting a signal and entering a position by:
Consolidating trading venues
Market intelligence
Capital deployment into a single interface
When on-chain data reveals accumulation patterns or whale movements, the platform eliminates the fragmented workflow that typically delays action.
Unified Access Removes Platform Switching
Trading across Bitcoin, Solana meme coins, Hyperliquid perpetuals, and Polymarket prediction markets typically requires separate accounts, distinct wallet configurations, and frequent asset transfers between services. Each transition consumes minutes that markets don't give back. Bullpen provides direct access to these venues through a single application, reducing operational overhead that can turn timely signals into missed entries.
Capital Velocity: The Competitive Edge of Unified Liquidity
When a stablecoin surge hits exchanges or whale wallets start moving assets, you're not hunting for the right platform or waiting for bridge confirmations. The infrastructure sits ready. Capital stays accessible across asset classes without the custody fragmentation that creates execution lag during volatile windows.
Performance-Based Intelligence Cuts Through Noise
On-chain metrics show wallet movements. They don't reveal whether those movements come from profitable traders or participants gambling on momentum. Bullpen surfaces verified PNL data from top traders on X through live leaderboards, filtering performance claims against actual results. When someone with documented profitability opens a position, that carries more weight than anonymous wallet activity you're trying to interpret on your own.
The Confluence of Capital and Conviction: Decoding Collective Intelligence
Notifications trigger when these proven participants act, creating a practical layer of behavioral intelligence that pairs naturally with blockchain signals. If on-chain data shows accumulation while multiple high-performing traders simultaneously enter long positions, the confluence suggests conviction backed by capital and track record.
You're not inferring intent from wallet flows in isolation.
You're watching how informed participants respond to the same conditions you're analyzing.
Streamlined Funding Eliminates Preparation Delays
Most traders fragment their workflow across four or five platforms. One tab for whale tracking, another for exchange flows, a third for execution, a fourth for funding. Context switching creates a lag between signal detection and action.
Bullpen consolidates:
Discovery and execution into one interface
Surfacing whale movements
Liquidity shifts
Verified performance data alongside trading tools
That compression eliminates the workflow fragmentation that creates blind spots during volatile periods, helping traders act while signals still carry weight.
The Capital Pipeline: Eliminating On-Ramp Latency for Real-Time Execution
Apple Pay integration and direct bank deposits remove the funding bottleneck that typically precedes position entry. Leverage options to align with strategy requirements without navigating separate margin systems. The preparatory steps that normally take 10 to 15 minutes are compressed into seconds, keeping you operationally ready when accumulation patterns emerge or liquidation cascades begin.
Speed Paired With Context
Raw speed without accuracy creates worse outcomes than careful delay. Rushing into positions based on incomplete signals generates losses faster than missing opportunities. Bullpen's structure addresses both problems simultaneously. The unified interface provides speed. The verified performance data and discovery tools provide context. You're not just moving faster. You're moving faster with better information about who else is positioning and why their track record matters.
The Psychology of the ‘Action Gap’: Overcoming Analysis Paralysis with Integrated Workflows
When exchange balances shift, stablecoin reserves surge, or whale wallets redistribute holdings, the window for optimal entry often measures in minutes. Platforms that separate analysis from execution force you to choose between thorough research and timely action. Consolidating both capabilities means you don't sacrifice one for the other.
Buy Crypto Today with Bullpen
If you want to turn on-chain insights into real trades without losing time to infrastructure hurdles, deposit on Bullpen today. You can trade across major Crypto markets from one place, earn a 500-point bonus on deposit, and receive a free introductory call when you fund $1,000 or more. That puts you in a position to act when opportunity appears, not after it has passed. The difference between spotting accumulation patterns and profiting from them comes down to whether your infrastructure supports speed or creates friction. Consolidating execution, discovery, and verified performance data into a single interface means you're ready when signals align, rather than scrambling across platforms as prices adjust.
Related Reading
Last Updated:
March 23, 2026