
Protect your assets with industry-leading blockchain analysis tools. Trace illicit flows, ensure AML compliance, and mitigate risk effortlessly.
The Crypto market moves fast, and if you're trading the best memecoins or any digital assets, you need to see what others can't. Transaction patterns, wallet behaviors, fund flows across networks, these signals separate profitable trades from costly mistakes. This article breaks down the best blockchain analysis tools for Crypto traders, showing you which platforms deliver actionable intelligence and how to use on-chain data to sharpen your strategy.
Understanding these analytics platforms matters most when you're ready to act on your research. Bullpen's buy Crypto solution addresses this need, enabling you to move from analysis to execution with minimal friction. Once you've identified opportunities through blockchain forensics and network monitoring, a streamlined way to acquire positions lets you capture the timing revealed by on-chain insights.
Summary
Blockchain transparency creates timing advantages that price charts cannot reveal. Every whale transfer, exchange deposit, and wallet accumulation pattern is recorded in real time on public ledgers. Traders monitoring these structural movements position themselves ahead of price reactions rather than chasing momentum after it becomes obvious. The data is available to everyone, but most traders do not review it until volatility has already arrived.
Exchange flow analysis preceded major market moves by hours or days in documented cases. Bitcoin deposits to exchanges spiked sharply before the May 2021 crash from $58,000 to below $40,000. Similar patterns appeared before the FTX collapse in November 2022, when exchange inflows surged as participants moved assets in response to emerging risks. The blockchain recorded the exodus before price reflected the panic, giving traders monitoring these flows advance notice that selling pressure was building.
Operational friction between analysis and execution eliminates informational advantages in fast-moving markets. Traders often run four or five tools simultaneously, synthesizing whale activity in Nansen, verifying exchange outflows in CryptoQuant, and checking sentiment in Santiment before switching to separate exchange interfaces to place orders.
Cross-chain complexity fragments capital efficiency and forces uncomfortable tradeoffs. Modern Crypto trading spans Bitcoin, Ethereum DeFi, Solana memecoins, and Layer-2 networks, each requiring separate wallets, gas tokens, and bridging steps. Capital locked in Ethereum cannot capture Solana opportunities without bridging delays of minutes to hours, depending on network congestion.
Information edges compress rapidly in transparent markets where on-chain transactions become public immediately. Academic research finds that Crypto markets exhibit 3 to 10 times the volatility of traditional assets, meaning informational advantages decay faster than in any other asset class.
Bullpen’s buy Crypto collapses the gap between signal recognition and execution by surfacing real-time whale activity, exchange flows, and high-performer positioning directly within the trading interface, thereby compressing the decision cycle from minutes to seconds.
Table of Contents
Why Serious Crypto Traders Use Blockchain Analysis Tools
Blockchain analysis tools reveal what price charts cannot: the structural movements of capital before they become visible in market action. While most traders react to:
Price changes after they occur
These tools reveal whale transfers
Exchange flows
Accumulation patterns in real time
This visibility creates a timing advantage that separates traders who anticipate from those who respond. The difference matters because Crypto markets operate on public ledgers. Every transaction, wallet movement, and fund transfer is recorded in real time. The question isn't whether the data exists. It's whether you can interpret it before everyone else does.
The Transparency Problem Most Traders Ignore
Price action feels complete. A chart shows:
Highs
Lows
Volume spikes
Support levels
Technical indicators add layers of confirmation. For many traders, this seems sufficient. What charts miss is the preparatory phase. Large holders don't announce their intentions. They move assets quietly between wallets, shift funds to exchanges, or withdraw holdings into cold storage. These actions precede market moves by hours or days. By the time the price reflects the activity, positioning is already complete.
On-Chain Behavioral Analysis & Educational Literacy
According to the Chainalysis 2025 Global Crypto Adoption Index, which analyzed Crypto adoption patterns across more than 154 countries, the infrastructure for tracking these movements has become globally accessible. Yet most traders still rely exclusively on delayed signals. They watch the price break out and wonder why they missed the entry. The answer usually sits in on-chain data that they never checked.
What Whale Movements Actually Signal
Large holders control enough supply to alter market conditions without trading publicly. When a wallet holding millions in assets moves funds, that activity conveys information. Not every transfer means an immediate sale, but patterns emerge.
Understanding the Mechanics of Exchange Inflow/Outflow
Transfers to exchanges typically increase available supply. If multiple large wallets deposit assets simultaneously, selling pressure may follow. Withdrawals suggest the opposite: assets moving into long-term storage reduce circulating supply. Clusters of these movements, especially when coordinated across similar wallet types, often precede volatility. Tracking this isn't about guessing intentions. It's about recognizing structural changes in supply and distribution before they manifest as price swings. Traders who monitor these flows position themselves ahead of momentum shifts rather than chasing them after the fact.
Exchange Flow Dynamics Reveal Buying And Selling Pressure
Exchanges function as liquidity hubs. Assets listed on an exchange are available for trading. Assets in private wallets are not. This simple distinction creates predictive value. Rising deposits signal potential selling intent. Sustained withdrawals tighten available supply. Stablecoin inflows indicate capital preparing to enter the market. Each of these flows appears in blockchain data before affecting price. When TRM Labs reported that stablecoins surpassed USD 4 trillion in volume, it underscored how much capital flows through these channels, most of it traceable and interpretable before it reaches spot markets.
The “Chart vs. Chain” Divergence
Monitoring these patterns creates context. A price drop accompanied by minimal exchange deposits suggests temporary weakness. The same drop with massive inflows signals distribution. The chart looks identical. The on-chain story differs completely.
Smart Money Leaves Visible Tracks
Institutional funds, experienced traders, and sophisticated entities operate through identifiable addresses. Advanced analytics platforms can track these wallets, revealing where capital flows before broader market awareness develops. When smart money accumulates a position, that activity is public. When they rotate from one sector to another, the transactions are recorded. In emerging areas such as new token launches and DeFi protocols, these early movements often precede mainstream attention by days or weeks.
Wallet Attribution and Smart Money Profiling
This isn't insider information. It's structural transparency. The blockchain records every transaction. The advantage comes from knowing which addresses matter and what their movements indicate. Traders who track these patterns gain visibility into where experienced participants are allocating capital, often before social media catches on.
Why Reactive Trading Costs More Than Most Realize
Relying solely on price creates a consistent lag. By the time a trend appears obvious on a chart, early participants have already positioned themselves.
Breakouts attract attention after accumulation completes.
Breakdowns become clear after distribution finishes.
This delay compounds in volatile markets. A trader enters what appears to be a strong uptrend, only to discover they bought near the top of an accumulation phase. Whale wallets were already moving assets to exchanges. The on-chain data showed a distribution beginning to form. The chart showed strength. Both were true, but one was earlier.
Liquidity Microstructure and Order Flow Analysis
I've watched traders interpret sudden volatility as irrational market behavior when the on-chain explanation was straightforward: a large holder liquidated, exchange deposits spiked, or a cluster of wallets coordinated exits. The moves weren't random. They were just invisible to anyone watching the price alone. Bullpen’s buy Crypto integrate real-time on-chain signals directly into the trading interface, surfacing whale activity and exchange flows alongside execution tools. This consolidation means traders don't need to toggle between analytics dashboards and trading platforms. The structural data that precedes price action becomes part of the decision-making process rather than an afterthought.
The Advantage Isn't Complexity, It's Timing
Blockchain analysis tools don't require predicting the future. They surface present activity that most traders overlook. Whale transfers happen now. Exchange flows update continuously. Accumulation patterns form in real time. The data predate the price reaction. The edge comes from acting on structural signals while they're still invisible to the majority. When large holders begin accumulating, supply tightens before charts show strength. When distribution starts, selling pressure builds before breakdowns occur. Traders who recognize these patterns position themselves ahead of momentum rather than chasing it.
The Confluence Framework: Bridging On-Chain Data with Execution
This isn't about having more information. It's about interpreting the right information at the right time. Crypto's transparency makes this possible. The challenge is knowing where to look and what the signals mean. But knowing what to track is only half the equation. The real question is how traders actually apply this data to make faster, more informed decisions.
How Traders Use These Tools to Gain an Edge

Blockchain analysis tools matter because they convert transparency into timing. The data is available to everyone, but most traders do not review it until the price has already moved. The edge comes from building workflows in which on-chain signals inform decisions before momentum becomes apparent. Professional traders don't monitor wallet movements for entertainment. They use these tools to spot accumulation before breakouts, detect distribution before crashes, and identify early adoption in new tokens where price history doesn't exist yet. The workflow separates those who react from those who anticipate.
Watching Exchange Deposits Before Sell Pressure Appears
Large inflows to exchanges create immediate liquidity. When significant amounts move onto trading platforms, those assets become available to sell. Sustained deposit activity across multiple wallets often precedes price drops by hours or days. In May 2021, Bitcoin deposits to exchanges spiked sharply before the market crashed from $58,000 to below $40,000 within days. The on-chain signal appeared before the price breakdown. Traders monitoring those flows had advance notice that selling pressure was building. Those watching only charts saw strength until it collapsed.
Solvency Auditing & Institutional Risk Forensics
CryptoQuant documented similar patterns before the FTX collapse in November 2022. Exchange inflows surged as participants moved assets in response to emerging risks. The blockchain recorded the exodus. Price followed later. This isn't a prediction. It's reading structural changes as they occur.
Building a Decentralized “War Room”
Teams often report frustration with fragmented workflows, toggling between analytics dashboards and execution platforms while trying to act on time-sensitive signals. Bullpen’s buy Crypto solution integrates real-time whale activity and exchange flow data directly into the trading interface, compressing the gap between signal recognition and execution. When deposit spikes appear alongside your order book, the decision cycle shortens from minutes to seconds.
Tracking Whale Accumulation During Quiet Periods
Large holders absorb supply gradually, often during consolidation phases when price action feels stagnant. This accumulation tightens available supply without creating visible momentum. Once demand increases, the reduced float amplifies price movement. During late 2020, Glassnode data showed addresses holding at least 1,000 BTC steadily increasing their balances while Bitcoin traded sideways around $10,000. The accumulation phase lasted weeks. By early 2021, Bitcoin rallied past $40,000. The on-chain pattern preceded the breakout by months. Traders who recognized the accumulation positioned before momentum traders entered.
The "Illiquid Supply" Divergence
Accumulation doesn't guarantee rallies, but it reveals where supply is being removed from circulation. When combined with technical setups, it adds confirmation that large participants are building positions rather than distributing.
Identifying Early Signals In Newly Launched Tokens
New tokens lack price history. Technical analysis offers little value when charts only span days. On-chain activity becomes the primary signal for gauging adoption and interest before mainstream attention arrives. Traders watch for:
Sudden growth in unique wallet holders
Liquidity additions to decentralized exchanges
Large purchases concentrated in a few addresses
Rapid increases in transaction volume
These patterns indicate early adoption phases. According to Santiment research, increases in on-chain activity often correlate with emerging market interest before social media amplifies awareness.
Spotting Early Momentum Before Liquidity Spikes
I've watched tokens launch with minimal fanfare, then see wallet counts triple within 48 hours while the price remained flat. The on-chain data showed accumulation happening beneath the surface. By the time Twitter caught on, early participants had already positioned themselves. The blockchain doesn't lie about who's buying and when.
Combining On-Chain Data With Technical Setups
Most professionals layer multiple signal types rather than relying on single indicators. On-chain insights provide context for chart patterns. A breakout supported by exchange outflows carries more weight than one occurring during rising deposits. The combination filters out noise while preserving meaningful moves.
Beyond Deterministic Trading
Common integrations include entering breakouts only when exchange outflows confirm reduced sell pressure, treating rising inflows as caution signals during rallies, using whale accumulation to validate support zones, and aligning volume patterns with transaction activity. According to a LinkedIn article on top trading strategies dominating, 70% of professional traders now use algorithmic systems that incorporate multiple data streams, including on-chain metrics.
Validating the “On-Chain Alpha”
Academic research supports this layered approach. Studies in financial journals have found that on-chain metrics improve cryptocurrency return forecasts when combined with traditional indicators, suggesting transaction-level data contains predictive information not captured by price alone.
Why Context Beats Raw Numbers
A single large transfer means nothing in isolation. Wallets move assets for custody changes, collateral adjustments, and operational needs unrelated to trading intent. Context separates signal from noise. Successful interpretation focuses on patterns across time and addresses. Sustained flows involving multiple large wallets carry more weight than isolated movements. When several addresses simultaneously move assets to exchanges, it suggests intentional positioning. One wallet moving funds might be routine treasury management.
Behavioral Crypto-Economics: The Psychology of Market Cycles
The edge comes from building narratives around:
Supply
Demand
Participant behavior rather than reacting to individual transactions
Blockchain transparency provides visibility, but profitable use requires understanding what the visible activity actually means. Traders who convert patterns into actionable positioning capture the advantage. Those who collect data without interpretation gain nothing.
Related Reading
The 21 Best Blockchain Analysis Tools (Detailed Reviews)

The tools that matter most are the ones that shorten the distance between insight and action. Some platforms excel at identifying capital flows. Others specialize in fundamental analysis or social sentiment. A few focus on forensic intelligence. But the real value emerges when these tools fit into a workflow where recognition converts to execution before the window closes. What follows isn't a feature comparison. It's a breakdown of which tools solve specific problems across the trading stack, and where each one creates the most leverage.
1. Bullpen: Best for Turning Insights Into Trades

Bullpen is not a traditional analytics dashboard. It is an execution platform designed to act on the insights generated by blockchain analysis tools. Instead of jumping between wallets, exchanges, bridges, and apps, Bullpen consolidates major Crypto markets into a single interface.
Key Strengths
Trade Bitcoin, Solana memecoins, Hyperliquid perps, and prediction markets in one place
Follow top traders on X with verified PNLs
Live leaderboard showing who is actually profitable
Real-time alerts when high-performing traders open positions
Buy crypto instantly with Apple Pay or bank transfer
Use leverage during fast-moving opportunities
For traders who already use on-chain data, Bullpen addresses the most common bottleneck: execution speed. Insights only matter if you can act before the opportunity disappears.
2. Nansen: Best for Smart Money Tracking

Nansen labels blockchain addresses to:
Identify funds
Whales
Insiders
Other influential participants
Core Capabilities
Real-time tracking of labeled wallets
Smart money dashboard
Token flow analysis
Strong coverage of DeFi and memecoin ecosystems
Nansen is widely used to monitor where sophisticated capital is moving before trends become obvious.
3. Glassnode: Best for Institutional-Grade Metrics
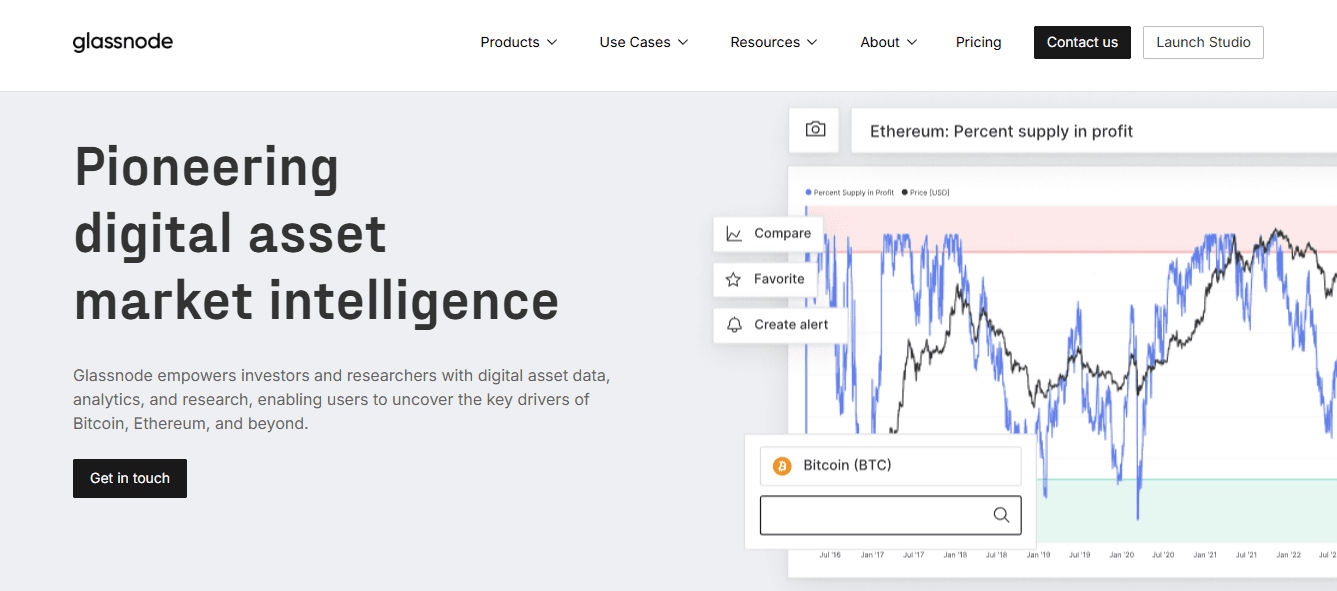
Glassnode focuses on macro on-chain analytics and long-term market structure.
Key Features
Market cycle indicators
Long-term holder behavior
Supply distribution metrics
Network health data
Its research is frequently cited by institutional investors and market analysts.
4. Arkham: Best for Wallet Intelligence

Arkham specializes in linking blockchain addresses to real-world entities where possible.
Core Capabilities
Entity attribution and wallet clustering
Tracking the activity of specific traders or institutions
Investigative analytics tools
Intelligence-focused dashboards
This makes it useful for monitoring large players and understanding who is behind major movements.
5. Dune: Best for Custom Dashboards
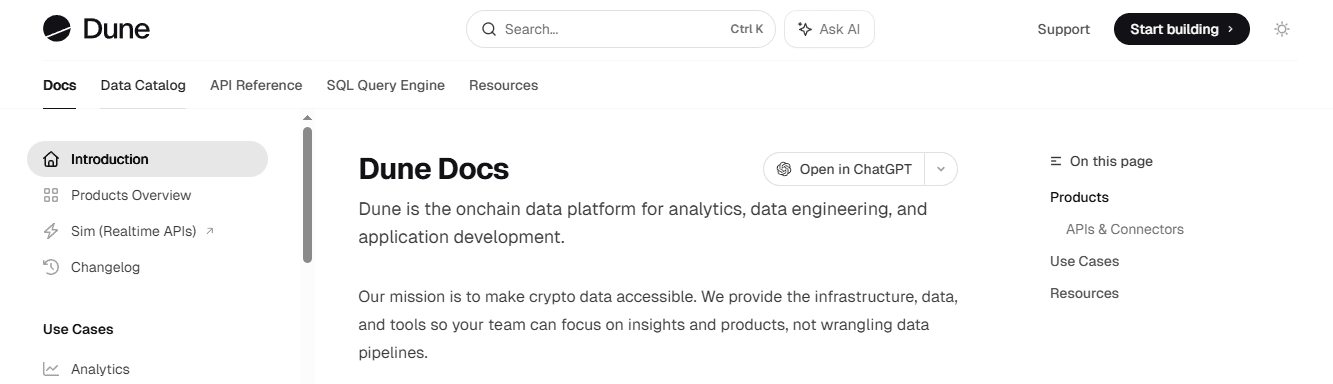
Dune provides access to raw blockchain data through user-created queries and dashboards.
Highlights
Community-built analytics
Deep protocol-level insights
Flexible SQL-based exploration
Coverage of DeFi, NFTs, and governance activity
Advanced users can build highly specific analyses tailored to niche strategies.
6. Santiment: Best for Sentiment Plus On-Chain Data
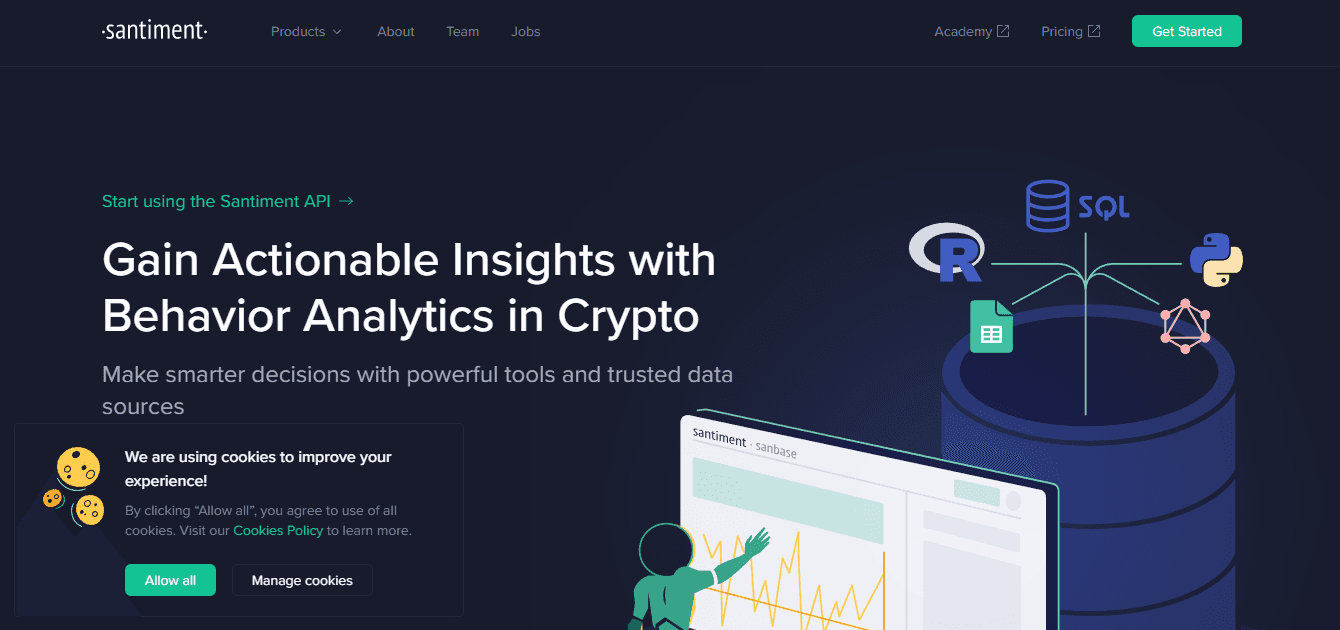
Santiment combines blockchain metrics with social and behavioral indicators.
Key Tools
Social media sentiment tracking
Development activity metrics
Network growth indicators
Behavioral market signals
This blend helps traders gauge both technical and psychological drivers of price.
7. CryptoQuant: Best for Exchange Flow Analysis

CryptoQuant focuses heavily on exchange-related metrics.
Core Features
Exchange inflow and outflow tracking
Miner activity indicators
Stablecoin flows
Market cycle analytics
It is widely used to anticipate potential sell pressure or accumulation phases.
8. IntoTheBlock: Best for AI-Driven Insights
IntoTheBlock applies machine learning to blockchain data.
Core Capabilities
Predictive indicators
Risk analytics
DeFi metrics
Holding behavior analysis
The platform aims to convert complex data into actionable signals.
9. Token Terminal: Best for Fundamental Analysis
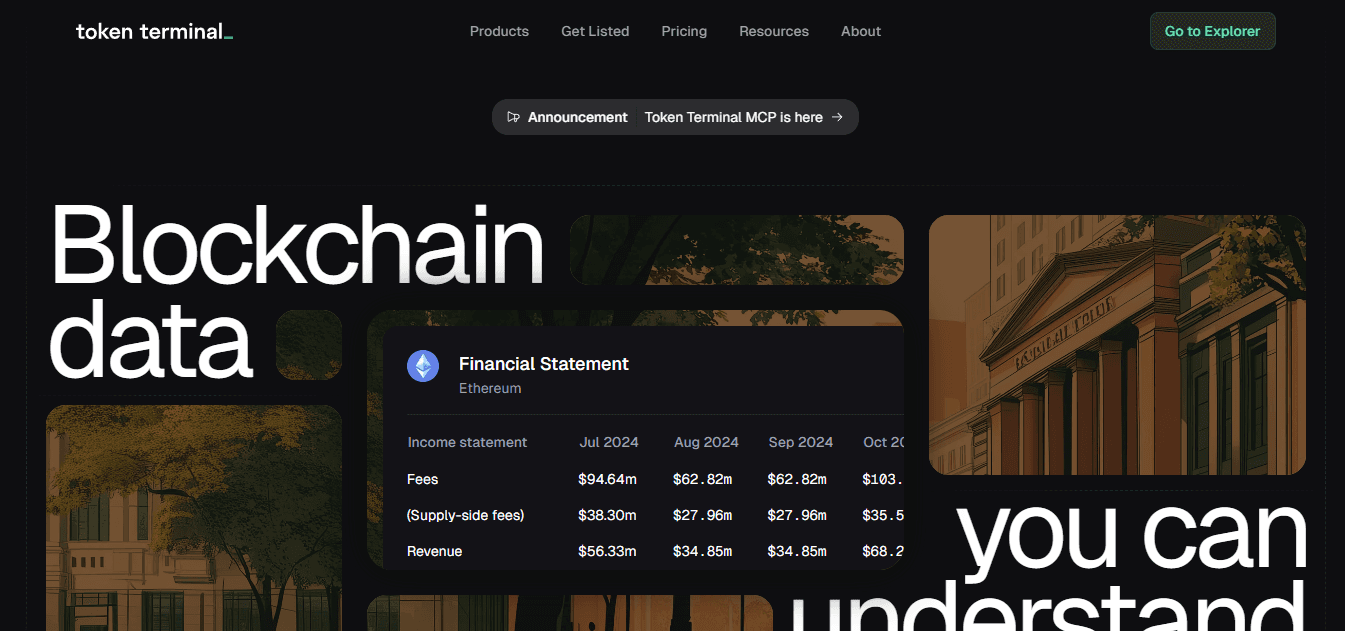
Token Terminal evaluates Crypto protocols using financial-style metrics.
Key Data Points
Protocol revenue and fees
Earnings-like measures
Valuation comparisons
Fundamental performance tracking
This approach treats Crypto networks more like businesses than speculative assets.
10. Messari: Best for Research Plus Data

Messari combines analytics tools with in-depth research coverage.
Key Features
Market intelligence dashboards
Asset profiles and reports
Industry research
Institutional-grade data
It is often used for macro analysis and portfolio-level decision-making.
11. Whale Alert: Best for Real-Time Large Transfers
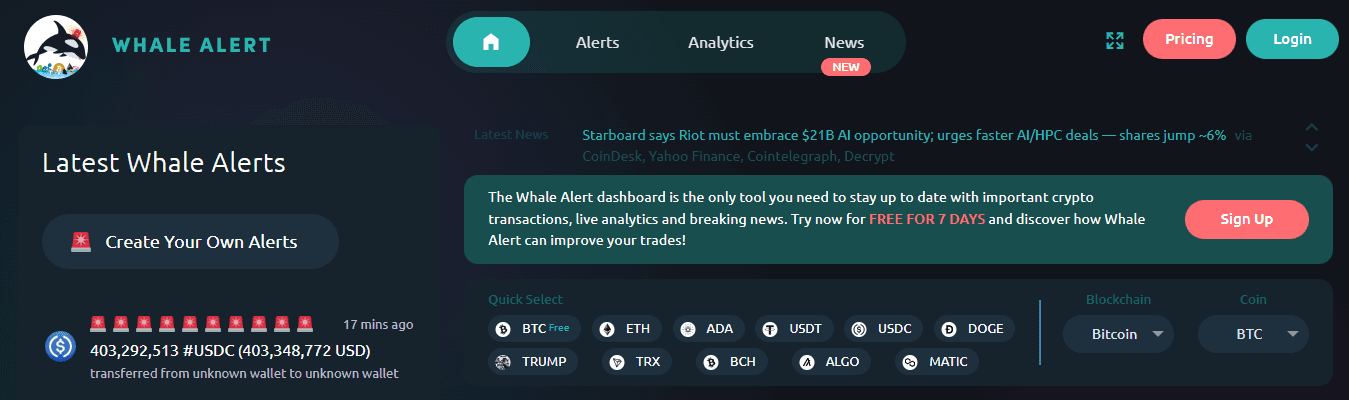
Whale Alert tracks major transactions across multiple blockchains.
Core Capabilities
Monitoring large wallet movements
Identifying exchange transfers
Real-time alerts via social channels
Cross-chain coverage
It provides immediate visibility into unusually large activity.
12. Etherscan: Best for Raw Ethereum Data
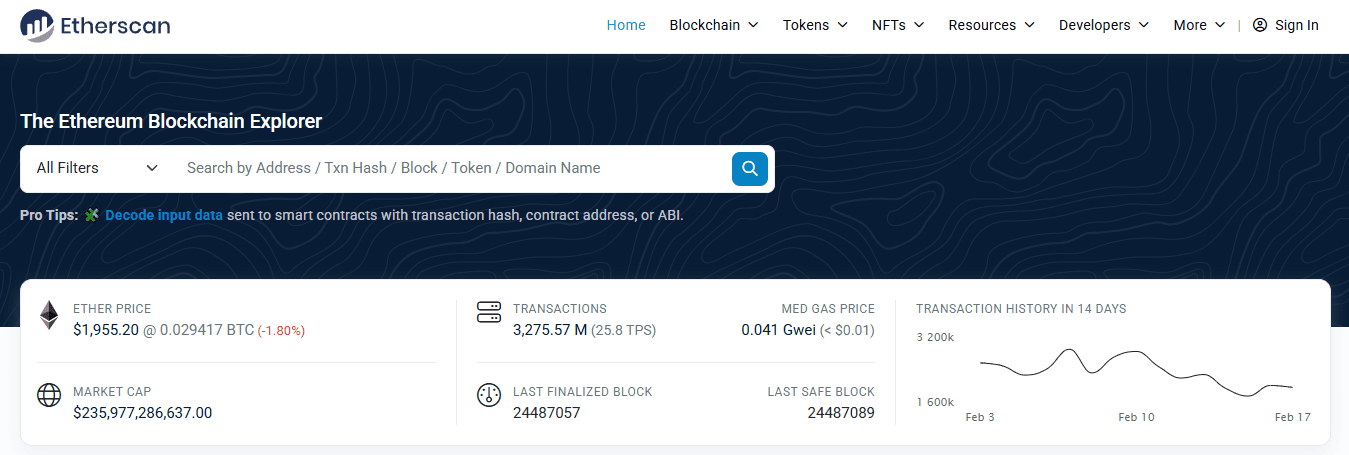
Etherscan is a blockchain explorer rather than a curated analytics tool, but it remains essential.
Core Capabilities
Transaction lookup
Wallet balance tracking
Smart contract interaction
Gas fee monitoring
It serves as a foundational source for verifying on-chain activity.
13. Blockchain.com Explorer: Best for Bitcoin Data
This explorer provides similar functionality for Bitcoin.
Key Uses
Tracking BTC transactions
Monitoring wallet balances
Network statistics
Historical block data
Useful for analyzing large BTC movements directly.
14. DeFiLlama: Best for Total Value Locked Tracking
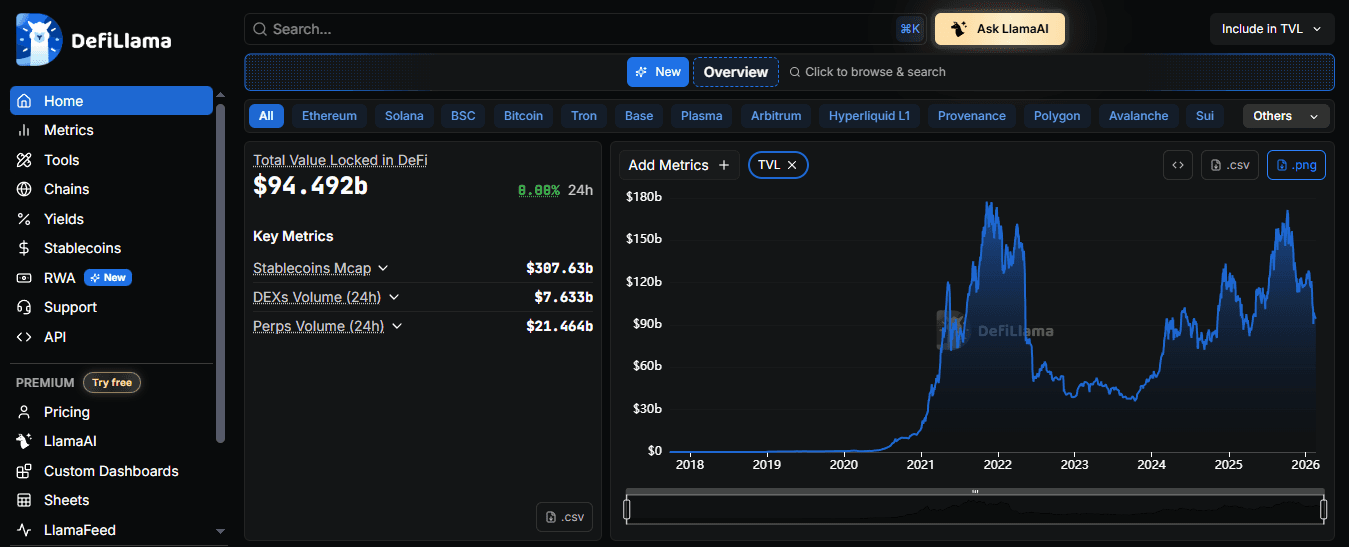
DeFiLlama focuses on capital flows within decentralized finance.
Highlights
TVL across protocols and chains
Yield data
Stablecoin supply tracking
Cross-chain comparisons
TVL changes can signal capital migration between ecosystems.
15. Coin Metrics: Best for Professional Data Feeds
Coin Metrics offers high-quality datasets for institutions and quantitative traders.
Key Features
Network fundamentals
Market data APIs
Research publications
Compliance-grade datasets
Often used by funds and research firms.
16. Kaiko: Best for Market Microstructure Data

Kaiko provides detailed trading data across exchanges.
Core Capabilities
Order book analytics
Liquidity metrics
Trade data aggregation
Institutional-grade feeds
Useful for understanding execution conditions alongside on-chain signals.
17. Chainalysis: Best for Compliance and Forensics
Chainalysis specializes in investigative analytics and regulatory use cases.
Key Functions
Illicit activity detection
Entity tracking
Compliance reporting
Risk scoring
Primarily used by governments, exchanges, and financial institutions.
18. TRM Labs: Best for Risk Intelligence
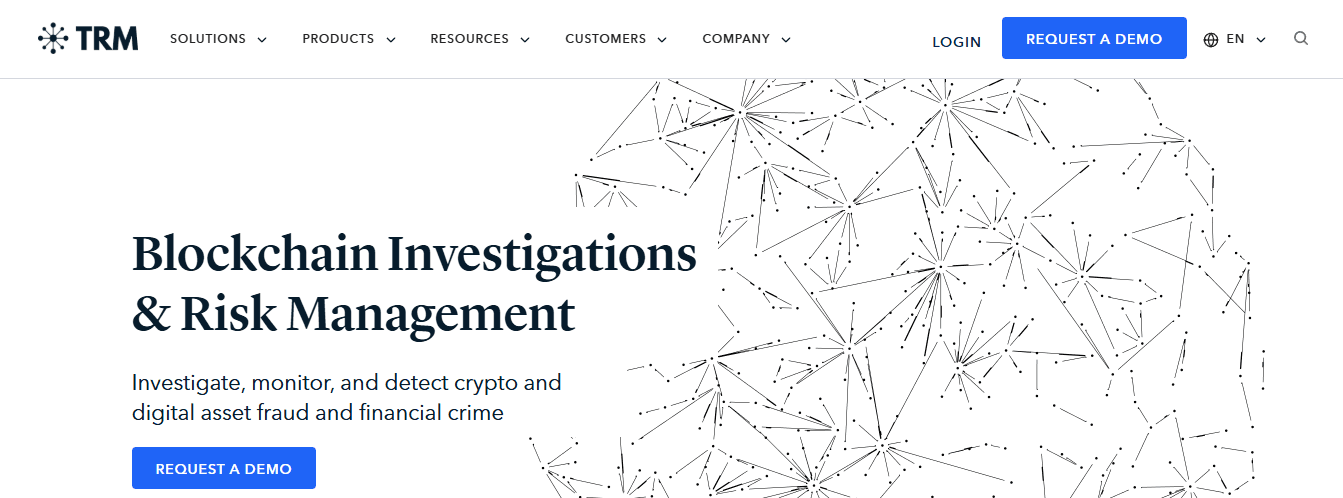
TRM Labs provides blockchain intelligence focused on security and compliance.
Core Features
Fraud detection
Transaction monitoring
Regulatory support
Investigative tools
Similar to Chainalysis but with distinct methodologies.
19. Blockchair: Best for Multi-Chain Search

Blockchair aggregates data across multiple blockchains.
Core Capabilities
Cross-chain transaction search
Address tracking
Network statistics
Advanced filtering
Useful for comparing activity across ecosystems.
20. CryptoRank: Best for Token and Fund Tracking
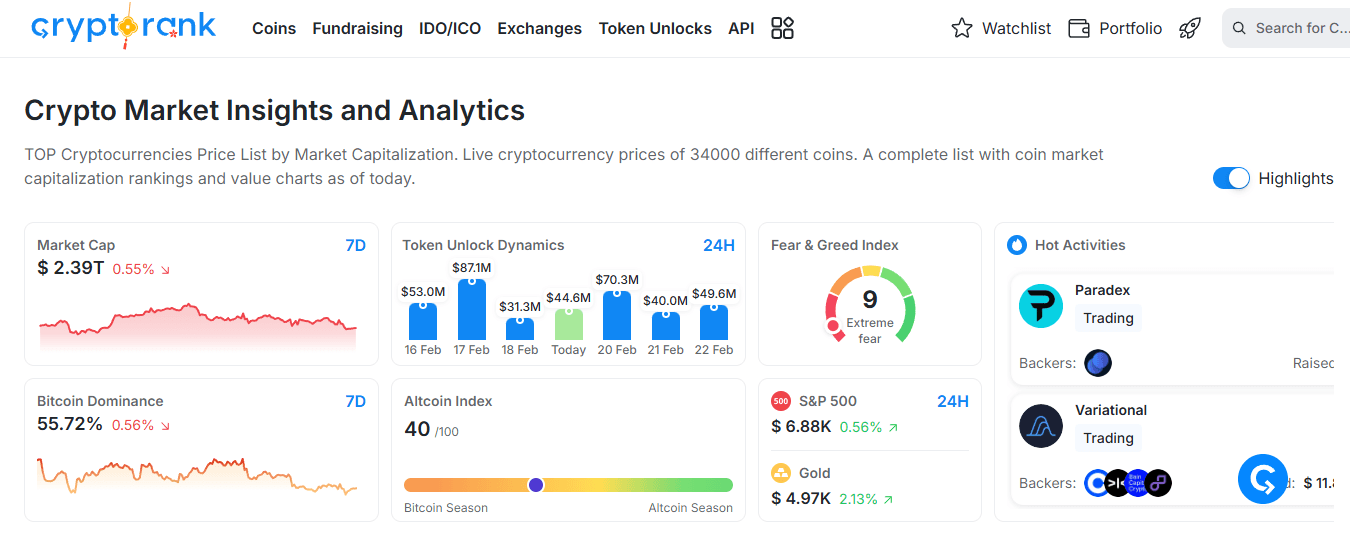
CryptoRank focuses on project analytics and investor activity.
Key Features
Fundraising data
Token unlock schedules
Portfolio tracking
Market performance metrics
Token unlock events can significantly impact supply dynamics.
21. LunarCrush: Best for Social Analytics

LunarCrush analyzes social engagement around Crypto assets.
Highlights
Social dominance metrics
Community growth indicators
Influencer activity tracking
Market sentiment signals
Social momentum often interacts with on-chain trends, especially in retail-driven markets.
The “Execution-First” Philosophy
These tools serve different purposes across the trading stack. Some reveal where capital is moving, others analyze fundamentals or sentiment, and a few specialize in forensic intelligence. In practice, experienced traders combine multiple sources to form a coherent view of market structure. The critical step is translating insight into timely execution. Data can highlight opportunity, but capturing it requires the ability to act quickly across fragmented Crypto markets.
Closing the Loop: From Trade to Tax
These tools serve different functions. Some reveal where capital is moving. Others analyze fundamentals or sentiment. A few specialize in forensic intelligence. Most experienced traders layer multiple sources to build a complete view of market structure. But tools only create opportunity. Capturing it requires execution infrastructure that matches the speed of the insights themselves.
Related Reading
Limitations: Why Analysis Without Execution Falls Short

The gap between recognizing opportunity and capturing it determines who profits in Crypto. Analysis reveals where the market is moving. Execution determines whether you move with it. In markets that operate continuously and react within seconds, the distance between these two actions isn't just inconvenient. It's the difference between positioning ahead of momentum and chasing it after everyone else sees the same signal. Blockchain data can show you exactly when whale wallets start accumulating. Exchange flow metrics can reveal distribution before price breaks down. Social sentiment tools can catch narrative shifts as they begin. None of it matters if you can't act before the window closes.
The Cost Of Switching Between Platforms
Serious traders often run four or five tools simultaneously.
One dashboard tracks on-chain activity.
Another monitors derivatives positioning.
A third handles portfolio tracking.
A fourth provides order book depth.
Each tool adds value independently, but together they create friction that compounds during volatile periods.
The “Missing Half-Second” of Execution
The problem isn't the quality of individual platforms. It's the operational drag of synthesizing information across disconnected interfaces while the market continues moving.
You spot a whale accumulation pattern in Nansen.
You verify exchange outflows in CryptoQuant.
You check social sentiment in Santiment.
By the time you switch to your exchange interface to place the trade, three minutes have passed. In Crypto, that's often enough for the setup to deteriorate or for the price to move beyond your intended entry.
Solving the “Verification Paradox”
When a cluster of smart money wallets begins coordinating moves, the signal appears across multiple analytics platforms nearly simultaneously. Traders monitoring these flows face a choice: act immediately with partial confirmation or wait for complete verification across all their tools. The first option risks false signals. The second guarantees delayed entry. Neither is optimal, but both are consequences of fragmented infrastructure.
Moving Capital Introduces Unavoidable Delays
Even when you identify the trade quickly, execution requires capital positioned on the right platform. If your funds sit on Coinbase but the best liquidity is on Binance, you're adding transfer time to your decision cycle. If you're trading across chains, the delays multiply.
Beyond the Bridge: Intent-Based Capital Routing
Bitcoin transactions require multiple confirmations before exchanges credit deposits. During network congestion, what should take 30 minutes can stretch to several hours. Ethereum is faster under normal conditions, but gas fee spikes during volatility can make small transfers economically irrational. Cross-chain bridges introduce additional steps, each adding time and counterparty risk. I've watched traders correctly identify accumulation patterns forming in real time, only to miss the subsequent breakout because their capital was locked in a bridge transaction. The analysis was perfect. The timing was right. The infrastructure couldn't keep pace with the insight.
Volatility Accelerates Faster Than Manual Processes
Crypto markets don't pause for operational logistics. During liquidation cascades, prices can move 5 to 10 percent within minutes. Stop losses trigger in chains, creating momentum that feeds on itself. By the time you manually verify signals, switch platforms, confirm wallet balances, and place orders, the initial setup may have already changed significantly. Academic research comparing cryptocurrency volatility to traditional assets consistently finds that Crypto markets exhibit 3 to 10 times the volatility of traditional assets, according to studies published in financial journals on market microstructure. This isn't occasional turbulence. It's a structural reality. The speed of price discovery in transparent, globally accessible markets means informational advantages decay faster than in any other asset class.
Low-Latency Infrastructure as a Risk Management Tool
When Bitcoin dropped over 30 percent intraday during the May 2021 volatility spike, the move was faster than most manual trading workflows could accommodate. On-chain data showed the distribution beginning. Exchange inflows spiked. The signals were clear. But traders using fragmented tools found themselves reacting to price action rather than positioning ahead of it.
Cross-Chain Complexity Fragments Capital Efficiency
Modern Crypto trading spans multiple ecosystems. Bitcoin remains the dominant store of value. Ethereum hosts the deepest DeFi liquidity. Solana attracts memecoin speculation. Layer-2 networks offer lower fees but require bridging from the mainnet. Each chain operates independently, with its own:
Wallets
Gas tokens
Liquidity pools
Solving the “Idle Capital” Problem
Capital locked on Ethereum can't capture opportunities on Solana without bridging. Funds in cold storage can't be deployed during sudden volatility without multiple confirmation steps. This fragmentation forces traders into uncomfortable tradeoffs: maintain idle capital across multiple chains to ensure readiness, or accept that some opportunities will be inaccessible when they appear. The operational overhead isn't just inconvenient. It's expensive. Idle capital earns nothing while waiting for deployment. Bridge fees and gas costs compound with each rebalancing. Complexity increases error risk during high-stress periods, when speed matters most.
Information Edges Compress Rapidly In Transparent Markets
Financial markets incorporate new information continuously, but Crypto's transparency accelerates this process dramatically. On-chain transactions are public immediately. Whale movements get flagged by multiple analytics platforms within seconds. Social media amplifies signals across global audiences in minutes. What begins as an informational advantage available to those monitoring the right data feeds quickly becomes common knowledge. Automated trading bots react to the same on-chain triggers that human traders watch. By the time you finish verifying a pattern across multiple dashboards, algorithmic systems may have already positioned based on the same signal.
Strategic Under-Confidence
The most experienced traders layer multiple confirmation sources before acting, creating inherent delays. But markets reward speed as much as accuracy. The trader who acts on 80 percent confidence often captures better positioning than the one who waits for 95 percent certainty. Fragmented tools force this tradeoff by making comprehensive analysis incompatible with fast execution.
Human-Computer Interaction (HCI) in High-Stakes Trading
Most traders solve this by accepting partial information and acting faster, or by demanding complete verification and accepting delayed entry. Bullpen’s buy Crypto solution collapses this trade-off by surfacing real-time whale activity, exchange flows, and high-performer positioning directly within the execution interface. When on-chain signals appear alongside order entry tools, the gap between recognition and action shrinks from minutes to seconds.
The Execution Bottleneck Nobody Discusses
The real constraint isn't identifying opportunities. Analytics tools have become sophisticated enough that most serious traders can spot accumulation patterns, exchange flow anomalies, and sentiment shifts with reasonable accuracy. The bottleneck is converting that recognition into positioned capital before the signal becomes consensus. Blockchain data reveals structural changes as they happen. Whale wallets don't hide their movements. Exchange deposits are publicly visible. Smart money leaves traceable patterns. The transparency creates a genuine edge for those who know where to look. But that edge only materializes as profit if you can act while the information still carries value.
Deterministic vs. Probabilistic Execution
In traditional markets, informational advantages might persist for hours or days before full incorporation. In Crypto, that window compresses to minutes or even seconds. The infrastructure you use determines whether you operate within or outside that window. Tools that separate analysis from execution guarantee you'll be reacting rather than positioning.
How Bullpen Turns Insights Into Trades All in One App
The solution isn't another analytics dashboard. It's infrastructure that collapses the distance between recognition and execution into a single action. Bullpen eliminates the operational steps that turn timely signals into missed opportunities by consolidating trading, funding, and intelligence into one environment built for speed.
Trade Across Major Crypto Markets Without Switching Platforms
Most traders maintain separate accounts for Bitcoin spot, Solana memecoins, perpetual futures, and prediction markets. Each venue requires:
Its own login
Wallet connection
Fund management
When capital rotation opportunities appear (moving from spot into derivatives during volatility, or shifting from majors into narrative-driven tokens), the logistics consume minutes that markets don't grant.
Reducing Strategy Lag Through Unified Trading Infrastructure
Bullpen brings these markets together. Bitcoin, Solana assets, Hyperliquid perps, and prediction markets operate from a single account. The consolidation matters because profitable strategies rarely confine themselves to one market type. A trader identifying whale accumulation in Bitcoin might simultaneously want exposure to correlated altcoins and downside protection through perpetual shorts. Executing that strategy across three platforms introduces delay at every step. Executing it through a single interface eliminates friction entirely.
From Fragmented Workflows to Integrated Strategy Execution
The familiar approach treats each market as a separate domain requiring specialized tools. That fragmentation made sense when Crypto trading meant occasional Bitcoin purchases. As strategies become more sophisticated, the operational burden compounds:
Monitoring on-chain flows
Rotating between narratives
Hedging spot positions with derivatives
Bullpen’s buy Crypto solution addresses this by unifying access, allowing traders to operate across market types without the constant context switching that turns insights into outdated information.
No Wallet Juggling Or Bridge Delays
Cross-chain activity typically requires managing multiple wallet addresses, each holding native gas tokens used to pay transaction fees. Moving assets from Ethereum to Solana involves connecting to a bridge interface, approving the token spend, waiting for confirmations, and then manually verifying receipt. During volatile periods when opportunities narrow, this process guarantees late entry.
Capital Mobility Without Operational Drag
Bullpen centralizes access so capital doesn't need constant repositioning. Instead of maintaining balances across five wallets and three chains, traders operate from a unified infrastructure. The reduction in operational steps matters most when markets move fastest. A whale accumulation signal loses value every minute you spend preparing to act on it.
Follow Traders With Verified Performance, Not Twitter Follower Counts
Social media amplifies voices based on engagement metrics, not profitability. A trader with 50,000 followers and consistent losses receives more visibility than one with 500 followers and verified gains. This creates information asymmetry, with attention shifting from skill to entertainment.
Verified Performance Signals and Real-Time Trade Transparency
Bullpen surfaces performance data instead of popularity metrics. Users can follow top traders whose profit-and-loss records are verified and public. A live leaderboard ranks participants by actual results, not narrative ability. When these high-performing traders open new positions, real-time alerts notify followers immediately. This transparency matters because timing determines whether a trade idea remains actionable. Discovering that a successful trader entered a position three hours ago provides context but a limited opportunity. Learning about it within seconds enables evaluation and action while the thesis remains valid. The infrastructure treats execution speed as equally important as signal quality.
Instant Funding When The Setup Appears
Capital availability often determines whether a trade occurs. Traditional funding methods (bank transfers taking 3-5 days, exchange deposits requiring multiple confirmations) create situations where traders recognize opportunities they cannot access. The analysis is correct, the timing is right, but the capital sits elsewhere. Bullpen allows instant Crypto purchases using Apple Pay or direct bank account connections. When a memecoin shows early accumulation patterns or a perpetual funding rate creates an arbitrage opportunity, the ability to deploy capital immediately converts insight into a position. Markets that move in minutes don't accommodate funding delays measured in hours.
Scale Positions With Leverage When Conviction Justifies It
Certain setups require amplified exposure to generate meaningful returns. A trader with $5,000 who identifies a high-probability move might need 3x or 5x leverage to make the trade worthwhile relative to risk. Without access to leverage, they either forgo the opportunity or accept returns that don't justify the research effort.
Conviction-Based Position Sizing Within a Unified Leverage Framework
Bullpen supports leveraged trading across its markets, enabling position sizing that matches conviction level and risk tolerance. This flexibility matters because not every opportunity warrants the same capital allocation. A strong technical setup with on-chain confirmation might justify higher leverage than a speculative narrative play. Having that optionality within the same platform where you execute removes another decision point that introduces delay.
From Signal To Position Without Friction
The core value isn't replacing analysis tools. It's about ensuring that insights from those tools translate into positioned capital before the information becomes consensus. A trader using Nansen to identify smart money accumulation and Glassnode to confirm exchange outflows still needs somewhere to execute when both signals align. If that execution requires switching to Coinbase, transferring funds, waiting for confirmations, and then manually placing orders, the workflow guarantees you're reacting rather than positioning.
Closing the Insight-to-Execution Gap
Bullpen treats the gap between insight and action as the primary constraint. By consolidating markets, funding, trader intelligence, and execution into one application, it transforms a fragmented process into a streamlined operation. The result isn't just convenience. It's the difference between acting while information is valuable and reacting once it becomes obvious.
Buy Crypto Today with Bullpen
The difference between seeing opportunity and capturing it comes down to infrastructure. You already know what to watch. The question is whether your tools let you act before the window closes. Deposit on Bullpen today to start trading across Crypto markets from a single platform. New users earn a 500-point bonus, and deposits of $1,000 or more include a free introductory call to help you get started. When on-chain signals appear, you're already positioned to execute.
No platform switching.
No bridge delays.
No missed entries because your capital was on the wrong chain during setup.
Just recognition and action, compressed into the same moment.
Related Reading
Last Updated:
March 23, 2026