
Find the edge you need. See our curated list of the best tradingView indicators for stocks, crypto, and forex. Improve your analysis today.
When you search for 'how to buy Bitcoin,' you face choices about timing, risk, and which tools to trust. TradingView charts offer indicators such as moving averages, RSI, MACD, Bollinger Bands, volume, support and resistance, trend lines, and Ichimoku that help you read price action and spot setups. Which indicator fits your plan, and when should you enter or exit a trade? This guide showcases the Best TradingView indicators every trader should know about for time entries, risk management, and building clear strategies.
Bullpen's buy crypto helps you act on those signals by making purchases simple, fast, and tied to chart alerts so you can move from analysis to execution with confidence.
Summary
The indicator ecosystem is enormous, with over 100,000 indicators and more than 10 million users, which accelerates niche discovery but also creates a volume of noise that teams must govern.
Customization is pervasive, with over 70% of traders using custom indicators; therefore, unchecked tweaking raises the risk of overfitting unless rules are backtested and versioned.
Community scripts drive faster idea flow, with approximately 40% of users engaging with them. Reuse demands code review and pinned versions to avoid silent drift.
Execution friction is a common killer of edge, so use a 30- to 90-day rolling live validation window to measure net expectancy after slippage, rather than relying on visual backtests.
Security failures are material, with 60% of companies reporting data breaches tied to poor practices, indicating that indicator systems require key rotation, least privilege, and regular audits.
Operational rules prevail at scale, for example, gating trend entries with ADX above 25, treating ADX below 20 as range mode, and sandboxing new or updated scripts with a 1- to 5-percent live allocation.
This is where Bullpen's buy crypto feature fits in, by connecting chart alerts to MEV-protected routing and on-chain order execution, thereby reducing latency and slippage between the signal and fill.
Table of Contents
What are TradingView Indicators?
4 Types of TradingView Indicators
15 Top TradingView Indicators Every Trader Should Know About
Choosing the Right TradingView Indicators
Common Mistakes to Avoid
Buy Crypto Today with Bullpen
What are TradingView Indicators?

TradingView indicators are the formulas and visual tools that translate price and volume into interpretable market signals you can:
Test
Share
Act on
They range from simple moving averages to complex community scripts that highlight momentum, liquidity, whale activity, and volatility so you can move from idea to an executable hypothesis.
How Do They Translate Market Data Into Signals?
Most indicators convert raw ticks into smoothed lines, histograms, or threshold alerts so patterns become visible at a glance. Some, like moving averages, confirm trends after the fact; others, like oscillators, flag potential turning points before the price follows.
Pine Script allows authors to combine price, volume, order flow proxies, and timeframes into bespoke rules, enabling a single chart to:
Display trend
Momentum
Risk simultaneously
How Large is the Ecosystem, and Why Does That Matter?
The ecosystem is vast, with over 100,000 indicators available on TradingView, which means you can usually find a niche script for runners, liquidity sweeps, or on‑chain flow proxies instead of building it from scratch.
That scope also attracts scale, as more than 10 million users utilize TradingView indicators, allowing popular ideas to be iterated quickly and battle-tested across various markets and timeframes.
Why Do Experienced Traders Still Get False Signals?
This pattern appears across both beginners and seasoned traders: they treat a single indicator as gospel, only to be surprised when it fails in noisy markets. It’s exhausting when MACD says one thing, RSI another, and price refuses to cooperate.
The failure mode is predictable, technical, and fixable: indicators are probabilistic filters, not certainties, and the remedy is deliberate confluence and explicit execution rules rather than wishful interpretation.
The Cost of Latency: Quantifying Edges Lost to Manual Execution
Most traders pull signals visually and then execute trades manually because this workflow is familiar and straightforward. That works early on, but as speed, slippage, and front‑running become meaningful costs, manual handoffs lose edges: missed fills, stale orders, and failed follow-through turn good signals into losing trades.
Platforms like Bullpen provide a bridge, tying discovery to MEV-protected routing, automatic transaction optimization, and advanced order types, allowing traders to compress the time between signal and execution while preserving auditability and public performance.
If You Want Indicators To Produce Repeatable Trades, How Should You Use Them?
Treat indicators as rule sets you can backtest, not aesthetic overlays.
Pick:
An edge
Define entry triggers
Stop logic
Size rules
Backtest across timeframes and market regimes. Utilize social features and public performance to validate that the signal remains consistent across different users and assets, and convert the tested rules into on-chain execution primitives to prevent manual transcription errors.
It’s one thing to read a line on a chart, and another to turn it into a rule that withstands real-world applications and MEV. But the frustrating part? This isn't even the most complex piece to figure out.
Related Reading
• Why Is Bitcoin Going Up
• Why Is Bitcoin Dropping
• If I invest $100 in Bitcoin Today, How Much Is It Worth in 2030
• Should I Buy Bitcoin Now
• Should I Buy Bitcoin
• What Is Bitcoin Halving
4 Types of TradingView Indicators

Trend, momentum, volatility, and volume indicators each play a distinct role in execution, and you should select them based on what you need to do next, not what looks impressive on a chart.
Use trend tools to define:
Direction and sizing windows
Momentum tools for time entries
Volatility tools to set stops and detect regime shifts
Volume tools to confirm whether a signal has real backing
1. Trend Indicators
Trend tools tell you which way to bias orders and which side of the book to defend. Use a moving average crossover or ADX-based rule to determine whether to take directional positions or stay flat, and convert those signals into concrete orders, for example, buy when the price closes above the 50 EMA and the ADX is above a chosen threshold.
The failure mode is transparent; trend following works until a market chops, so add filters such as higher-timeframe alignment or minimum trend strength to avoid being whipsawed. For position sizing, treat trend strength as a multiplier: a stronger trend corresponds to a larger size within risk limits.
2. Momentum Indicators
Momentum tools like RSI and stochastic are best suited for timing entries within an identified bias, rather than for creating bias on their own. Use them to trigger entries when momentum re-accelerates in the direction of your trend rule, for instance, enter long after a pullback when momentum crosses back above a threshold on a shorter timeframe.
This approach reduces false breakouts because you require both direction and acceleration before risking capital. After working with traders across retail and prop desks, the pattern became clear: many pick a momentum script and execute visually, then wonder why their signals underperform in live fills.
The missing step is mapping that momentum trigger to:
Explicit order parameters
Slippage caps
Exit rules
From Visual Signal to Executable Rule: Automating the Trade Handoff
Most teams manage discovery visually because it is familiar and fast. That works early on, but as speed and front-running matter, manual handoffs fragment execution and incur real edge costs.
Platforms like Buy Crypto compress discovery to execution with MEV-protected routing, automatic transaction optimization, and advanced order types, so signals become executable rules rather than sticky notes.
3. Volatility Indicators
Volatility measures tell you how wide the market breathes right now, and you must translate that into stop distances and position size. Use ATR to set adaptive stops and scale size down when ATR expands, or use Bollinger Band squeezes to detect imminent breakouts and predefine an entry-within-range plan.
The key tradeoff is responsiveness versus noise; shorter ATR lengths react more quickly but generate more false signals, while longer lengths filter more but react later. A good rule is to backtest stop rules across regimes, then lock them into your execution system so stop placement is consistent and not subject to emotional tightening.
4. Volume Indicators
Volume indicates whether price movements have backing, and in crypto, you should prioritize indicators that proxy for on-chain or order flow concentrations, such as volume profile, OBV, or community scripts that highlight large trades and accumulation zones.
Use volume as a final confirmation, for example, only take breakouts that occur with above-average volume on the breakout candle.
Validating Signals with Crowd-Tested Volume and Liquidity Filters
Pattern recognition reveals that the most significant mistakes occur when traders overlook the importance of size: price can move on low liquidity and then reverse, resulting in a full spread and additional losses.
To validate signals more efficiently, integrate community filters into your workflow, as approximately 40% of TradingView users interact with community scripts, which accelerates the discovery of crowd‑tested flow indicators and custom volume tools.
Practical Tradeoffs And Final Tips
To confirm, use trend indicators to set directional bias and higher-timeframe context, momentum to:
Refine entries inside that bias
Volatility to size
Protect
Volume
A single indicator should not carry the whole decision; instead, chain them into a rule pipeline with explicit numeric triggers and a tested stop and size schedule.
How Should You Approach Custom Scripts And Community Tools?
Treat custom indicators as starting points, not finished systems. Given that over 70% of traders use custom indicators on TradingView, customization is a standard practice; this popularity can create noise.
Your discipline is to backtest a custom script across multiple assets and timeframes, translate its outputs into order rules, and then automate execution so you do not lose the edge to execution latency or manual error.
From All-in-One Hype to Real-World Performance: Testing Indicators Against Market Friction
Bullpen puts all of crypto in one app:
Bitcoin
Solana memes
Hyperliquid perps
Polymarket
You can stop juggling wallets and bridges, follow verified PNLs, and get notified the moment top performers open a position.
Buy crypto with Apple Pay, use leverage, or buy Bitcoin with your bank account. Deposit today to earn a 500-point bonus, and get a free introductory call when you deposit $1,000 or more on Bullpen.
That solution sounds tidy until you test it live, and then you start to see which indicators truly survive the market’s friction.
15 Top TradingView Indicators Every Trader Should Know About

These 15 indicators form a practical toolkit that traders use to turn chart signals into repeatable trade rules that can be executed and measured.
Below, I list each indicator, its best execution role, concrete settings or order mappings to try on-chain, and the standard failure mode you must guard against.
1. Moving Averages (MA & EMA)
Use them to set bias and define dynamic support or resistance for order placement. For execution, translate a crossover into a concrete rule, for example, submit a limit buy when the 9 EMA closes above the 21 EMA on your chosen timeframe and the close is above the 50 SMA on the higher timeframe, with a preset slippage cap and a time-in-force of 'immediate-or-cancel'.
Think of MAs as guardrails, not triggers; they keep you on the trend, but they arrive late in chop, so tighten size or require higher-timeframe confirmation during sideways markets.
2. Moving Average Convergence Divergence (MACD)
Treat MACD as momentum confirmation for entries you've already biased with trend tools. Map a MACD signal line crossover into an aggressive market-taker entry only when the histogram expands and higher-timeframe momentum is aligned; otherwise, use it to scale in with limit orders.
Use faster MACD settings for intraday scalps and slower for swing trades, and always bind the signal to an ATR-based stop to avoid late entries during whipsaws.
3. Average Directional Index (ADX)
Use ADX as the trend strength gate, not an entry trigger. Operational rule: only enable directional order logic when ADX is above 25 on the higher timeframe, then allow trending entries on lower-timeframe pullbacks.
If the ADX is low, switch your system to range mode and favor oscillators or mean-reversion orders instead, as ADX values below 20 typically produce low-probability directional setups.
4. Supertrend Indicator
Treat Supertrend as a visual trailing stop and quick-exit rule. Convert a flip into either a hard close of an active position or a trigger to tighten trail stops; for aggressive strategies, you can enter on a confirmed flip, accompanied by volume confirmation.
Avoid using it as a lone entry in choppy markets, since frequent flips will turn a winner into a string of small losses.
5. Relative Strength Index (RSI)
Use RSI to time entries inside an established bias, for example, buying pullbacks when RSI re-crosses 40 toward 50 in an uptrend. Automate risk by tying RSI thresholds to position sizing, reducing lot size when RSI signals occur in extreme volatility.
Remember, RSI can stay extended during trending moves, so a trend filter before treating an overbought or oversold reading as a reversal cue.
6. Stochastic Oscillator
Make Stochastic your short-term timing layer inside a directional bias. Convert %K/%D crossovers in extreme zones into limit-entry attempts on pullbacks, but only when the higher-timeframe trend supports the move.
Because Stochastic fires early, pair it with volatility filters, such as a short ATR check, to avoid premature entries during strong market moves.
7. Volume Profile
Use Volume Profile to identify concrete price levels for limit orders and stop placement, for example, placing entries just beyond a low-volume gap or stops beyond the point of control. Operationally, code executions prefer fills inside value areas and use market-taking only when the price breaks out of a high-volume node with above-average session volume.
Volume Profile helps you place orders where real liquidity sits, but it rewards discipline: too many overlays will clutter decision-making.
8. Fibonacci Retracement
Use Fibonacci lines as confluence zones, not exact price magnets. When a retracement level aligns with an MA, VWAP band, or a volume node, convert that confluence into a limit-entry band and a paired stop distance based on ATR.
Treat the 61.8 level as a high-probability area for swing re-entry when multiple confirmations converge, but keep swing points consistent across tests to avoid subjectivity.
From Mental Rule to On-Chain Order: Eliminating Execution Friction
Most teams handle indicator discovery visually because it is quick and familiar, and this approach works well at a small scale. Over time, the cost appears, orders become inconsistent, and execution errors creep in when rules live only in a trader’s head.
Platforms like Bullpen provide teams with a way to lock those exploration rules into executable on-chain orders, featuring MEV-protected routing and automated transaction optimization, thereby reducing the friction between identifying a signal and capturing the fill.
9. Volume Weighted Average Price (VWAP)
Treat VWAP as the institutional reference for intraday bias and execution fairness. Automate strategies so that buys above intraday VWAP use limit-size-at-midpoint logic and buys below VWAP use smaller market-taker slices, with maximum slippage thresholds.
VWAP resets daily, so ensure your rule engine resets accordingly, and avoid relying on VWAP in thinly traded tokens where it becomes unreliable due to noise.
10. Ichimoku Cloud
Use Ichimoku to define multi-layer bias and projected support/resistance, then translate cloud breaks into orders that have longer duration and wider stops. For example, when the price closes above the cloud and the conversion line crosses the baseline, enable trend-following orders with trailing stops set to the Kijun distance.
Ichimoku is dense, so code explicit Boolean checks for each component to remove interpretation ambiguity.
11. Average True Range (ATR)
Use ATR strictly for adaptive sizing and stop placement. Convert ATR into a concrete rule, such as stop = entry price minus (X times ATR), and position size as a function of that stop distance to keep risk per trade constant.
ATR does not tell you the direction, so always bind it to directional confirmations before taking a position.
12. Lux Algo Premium
When using Lux Algo or similar suites, extract the raw signals you trust and convert them into testable rules. Treat these scripts as hypothesis generators: backtest the indicator signals across assets and then lock the best-performing rule into an execution primitive so you are not manually reinterpreting alerts.
Paid suites simplify discovery, but avoid overfitting by testing across market regimes.
13. QQE Mod (Quantitative Qualitative Estimation)
Use QQE Mod as a noise-reduced momentum layer. Translate crossovers into entry windows and add a confirmation requirement from volume or trend strength before executing.
Because QQE smooths signals, it can be a reliable trigger for timed entries, but you must still map its outputs to precise order parameters rather than acting on visual cues.
14. SSL Channel
Use SSL Channel for clear trend labelling and exit signals, mapping color flips into stop adjustments or position exits. For trend strategies, keep entries on the color-confirmed side and use flips to tighten stops or take full profit.
Be aware that SSL gives late signals in tight chop, so temper position size or require higher-timeframe alignment.
15. Wave Trend Oscillator
Use Wave Trend as a reversal timing tool, especially on lower timeframes, where signal line crossovers can indicate short, high-probability moves. Convert a Wave Trend crossover into a pre-sized market or limit entry with a tight ATR-based stop and a small profit target scaled to volatility.
It smooths better than some oscillators, but like all oscillators, it benefits from a trend filter or volume confirmation.
Formalizing the Edge: From Volatile Signal to Deterministic Execution Rule
After testing these in live runs over several months, the pattern was clear: indicators give edges until execution becomes inconsistent, then the edge evaporates. Teams that formalize triggers into deterministic order rules and then run those rules through protected routing and slippage controls maintain the edge as volume and competition rise.
A quick tactical checklist to use while building rule-based signals: always lock indicator thresholds, bind them to a higher-timeframe bias, automate stop and size calculation from ATR, and require at least one volume or liquidity confirmation before enabling market-taking legs.
That workaround feels like progress. What almost nobody admits is what breaks it at scale.
Choosing the Right TradingView Indicators
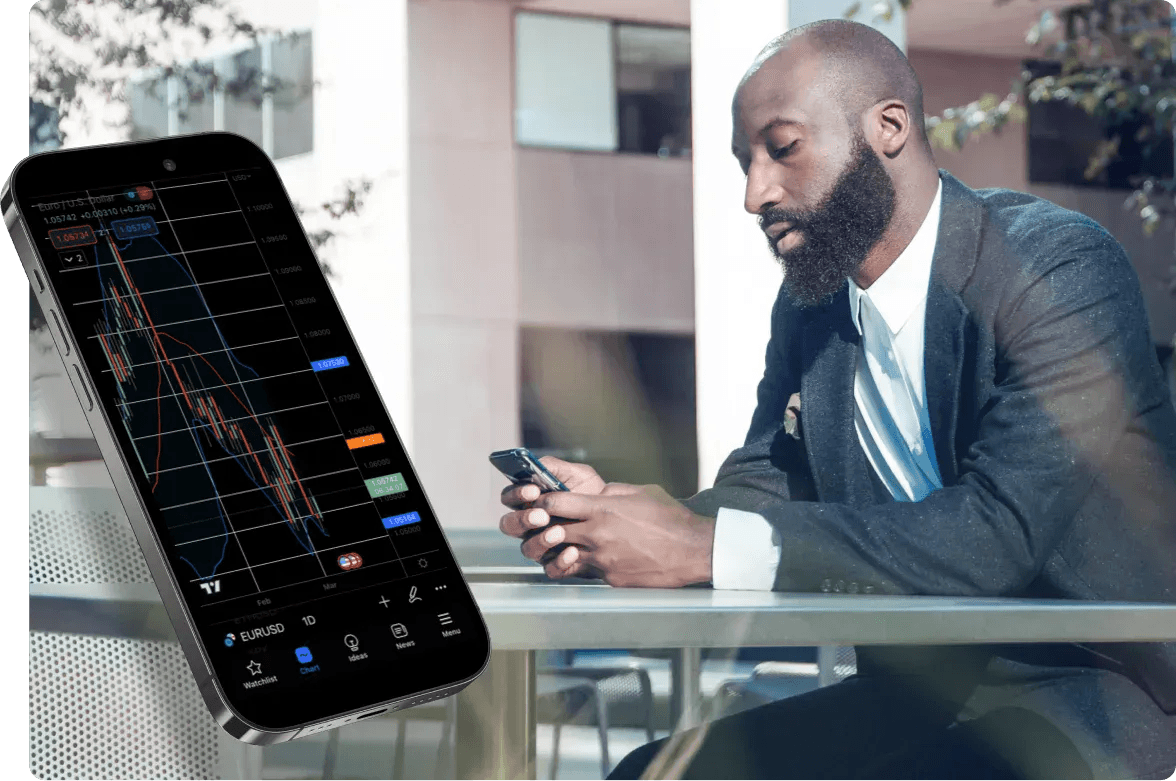
Choosing the right indicators is primarily an operational question, not an aesthetic one: select tools that you can measure, score, and retire when they stop adding value.
The right system provides repeatable signals that you can test against real fills and then automate, ensuring your edge survives competition and execution frictions.
How Do You Prove An Indicator Still Works?
Run rolling, out-of-sample validations rather than one-off backtests, and track execution-aware KPIs: net expectancy after:
Slippage
Fill rate
Signal latency
Treat a 30- to 90-day rolling window as the baseline for live confirmation, and log every alert to compare the theoretical entry price with the actual fill price, allowing you to calculate real-world edge decay.
Think of it like tuning a race car suspension: you test one change, record lap times, then return the car to its baseline before making the next tweak, because cumulative changes can hide which adjustment actually helped.
What Should A Signal Confidence Score Include?
Build a composite score from:
Recent performance
Uniqueness
Execution cost
Weight recent on-chain fills higher than historical visual success, penalize signals that correlate above 0.8 with other active scripts, and incorporate liquidity exposure. Therefore, a high score requires both alpha and tradability. This converts subjective trust into a numerical gate that you can use for position sizing and for gating market-taking legs.
How Do You Manage Indicator Drift And Versioning?
This pattern appears across retail and prop desks, where a script that worked in January fails by March because the market regime shifted or the script author updated code, creating silent drift.
Enforce version pinning:
Lock to a specific script commit or timestamp
Run a sandboxed live allocation of 1 to 5 percent for any new or updated script
Require a documented rollback plan
Automate alerts for statistical drift, for example, when the rolling expectancy falls below the sum of the expected execution cost and the required risk premium.
The End of Spreadsheets: Linking Discovery to MEV-Protected Execution
Most teams handle discovery visually and stitch signals into spreadsheets because it is familiar and fast. That works early on, but as signals multiply and timing becomes critical, manual handoffs fragment context and increase missed fills and inconsistent sizing. Platforms like
Bullpen compresses that workflow by:
Linking discovery
Public performance
Execution primitives
It allows teams to validate a signal on-chain, track its live leaderboard performance, and route the resulting orders with MEV-protected routing and transaction optimization, thereby reducing the latency and slippage that typically eat into an edge.
When Should You Retire Or Recalibrate An Indicator?
Set explicit retirement criteria rather than relying on gut. A practical rule is to retire or recalibrate when the indicator’s live, after-cost expectancy is no longer distinguishable from zero with your chosen confidence level, or when its correlation with other system components makes it redundant.
Recalibration should be documented in a change log, including:
Parameter shifts
The reason for the change
A new out-of-sample test before the indicator is returned to production
How Can Community Scripts Be Used Safely?
Treat community indicators as hypothesis generators, not production rules.
Before scaling:
Pin the script version
Audit the Pine code for hidden assumptions
Run controlled A/B tests across assets and timeframes
Limit initial exposure, monitor attribution to confirm the script is the causal factor in performance, and require author provenance and update transparency for any script that graduates to a funded allocation.
Why Does This Reduce Analysis Paralysis?
This challenge persists consistently: too many ungoverned signals cause conflicting calls and hinder decision-making, as traders lack a single source of truth about which signals are live and why.
A governance layer and confidence scoring replace noise with a prioritized queue, which feels less like making a leap and more like executing a plan.
Beyond the Features: Identifying Which Trading Mistakes Cost Real Money
Bullpen combines discovery and execution, allowing traders to:
Follow verified PNLs
Test community ideas against live fills
Convert trusted signals into MEV-protected orders without switching tools,
It makes it faster to act on what actually works.
Deposit today to earn a 500-point bonus and get a free introductory call when you deposit $1,000 or more, and use the in-app features to buy crypto, track leaders, and automate execution.
That solution sounds tidy until you test it live, and then you start to see which mistakes cost real money.
Related Reading
Common Mistakes to Avoid
You can avoid the usual indicator traps by treating mistakes as operational failures, not personality flaws: stop letting signals pile up, measure what happens when an alert fires, and govern every script that touches execution.
Do those three things, and indicators become accountable inputs you can optimize, rather than a noisy habit that erodes your edge.
Which Operational Mistakes Actually Kill An Edge?
This problem appears across retail and property settings: teams add indicators to chase false confidence, then create alert storms that interrupt the decision-making process. The real failure mode is not the tool itself; it is the workflow around it, where alerts are unmanaged, priorities are unclear, and nobody measures the gap between a visual signal and the actual fill.
Think of it like a control tower with too many radios active, each shouting different vectors; the pilot freezes, and the plane drifts.
How Do Security And Tooling Silently Break Trust?
Security lapses and outdated toolchains allow signals to leak, get altered, or fail when you need them most, which is why 60% of companies have experienced data breaches due to poor data security practices.
According to Analyst Uttam, this is a sharp reminder that indicator systems must be treated like production services with key rotation, least privilege, and periodic audits. If you run community scripts without code review or keep API keys broadly scoped, you are inviting either silent failures or active theft, and neither of these issues is detected in a backtest.
What Governance Stops Indicators From Quietly Drifting?
Treat each indicator like a software release. Pin the script version, require a documented change log for parameter updates, and roll new settings into production through a tiny canary allocation for 30 to 90 days while you track real-world KPIs.
The KPIs that matter are not theoretical win rate; they are net expectancy after slippage, fill rate, and time-to-fill. Automate alerts for drift, and if rolling expectancy crosses your cost threshold, quarantine the signal until you can explain the decay.
Centralizing the Workflow: Scoring Signals by Execution Cost to Defeat Latency
Most teams handle discovery visually because it is familiar and fast. That works early on, but as alerts scale, spreadsheets fragment and execution becomes inconsistent, so edges vanish.
Platforms like Bullpen centralize:
Discovery
Score signals by execution cost
Connect alerts to:
MEV-protected routing
Automatic transaction optimization
Advanced order types
It reduces the latency and slippage that otherwise turn a promising signal into a lost trade.
How Should You Test Indicators Beyond Classic Backtesting?
Build execution-aware A/B tests rather than running more optimistic historical sweeps. Randomize order types, run matched control trades that simulate real slippage, and log signal-to-fill deltas so you can compute a realistic net expectancy.
Use out-of-sample windows that reflect current liquidity conditions, and force tests to include adverse selection periods, because a strategy that performs well in smooth markets and implodes in stressed sessions is a hidden loser.
What Small Habits Prevent Big Mistakes?
Limit the number of active indicators on a template to a handful and require each one to pass an execution gate before it is allowed to trigger market-taking legs. Keep parameter granularity coarse so you avoid overfitting; require a documented liquidity threshold and a minimum order book depth before any market-taker order is permitted; and make logging mandatory, pairing every alert ID with the actual fill record.
Those simple rituals reduce analysis paralysis and create a measurable feedback loop, which is crucial, as over 70% of data analysts report that using outdated tools significantly hinders their productivity. This is because modern workflows compress decision time and surface failures faster.
The Workshop vs. The Garage: Formalizing Indicators to Scale Your Edge
If you want one practical image to remember, picture a workshop: tidy benches, labeled tools, and a single instruction sheet per task, versus a crowded garage where everyone grabs a wrench that looks right. The former scales; the latter multiplies mistakes.
The part that unravels everything is not the indicator itself; it is what you do after it screams for attention. Keep reading to see what comes next.
Buy Crypto Today with Bullpen
Consider Bullpen if you want one app that ends the juggling and lets you act when signals become trades; with BeInCrypto's 2023 estimate of a 50% increase in crypto adoption by 2025 and the prediction that Bitcoin could reach $100,000 by 2025, the market is primed, so access and execution now determine whether you capture opportunity or watch it pass.
I know the onboarding friction is real, and familiar payment methods like Apple Pay, combined with transparent leaderboards, make funding and following winners feel less risky. So, deposit to claim a 500-point bonus and a free introductory call after $1,000, then buy crypto with Bullpen to trade smarter and faster in one place.
Related Reading
Last Updated:
January 27, 2026