
Stop guessing and start winning. We reveal the 17 best crypto analysis tools for deep on-chain data and professional chart analysis.
Ever watched Bitcoin surge while you sat on the sidelines, wondering what signals the pros saw that you missed? Understanding what drives crypto price movements isn't just about luck or timing. It's about having the right analysis tools to spot patterns in price charts, track trading volume, read market sentiment, and interpret technical indicators before the crowd catches on. This guide reveals the professional-grade crypto analysis platforms, charting software, and data tracking systems that successful traders rely on daily to make informed decisions in volatile markets.
Whether you're trying to identify entry points, set stop losses, or understand blockchain metrics, the tools you use matter. That's where Bullpen steps in to simplify your crypto journey. When you're ready to act on your analysis and buy crypto, Bullpen offers a straightforward platform that connects your research to actual trades without the usual friction. You can focus on learning which moving averages, RSI levels, and on-chain analytics actually predict price movements instead of wrestling with complicated exchange interfaces.
Summary
Professional crypto traders now use an average of three or more analytics platforms simultaneously, according to Nansen's 2025 research, with over 70% relying on multiple tools to gain a trading edge. This fragmentation isn't a preference. It's a necessity in markets where advantage comes from synthesizing signals across price action, on-chain data, sentiment tracking, and derivatives positioning before opportunities close.
Task switching between disconnected tools reduces productivity by up to 40%, according to research from the American Psychological Association. For crypto traders, this overhead translates directly into missed entries, delayed reactions, and positions taken at worse prices.
Companies using 10 or more different data analysis tools experience decision paralysis rather than clarity, with 72% of organizations falling into this trap according to Gartner's 2025 findings. In crypto trading, this manifests as conflicting signals across platforms (bullish on-chain accumulation, negative funding rates, declining social sentiment) without a clear framework to determine which input actually matters for the current opportunity.
Teams that consolidate to three or fewer business intelligence tools see 40% faster decision-making, according to McKinsey research. For crypto traders, faster decisions mean better entries, tighter stop losses, and the psychological momentum that comes from acting on conviction rather than hesitating amid doubt while reconstructing context across multiple platforms.
On-chain analysis reveals wallet behavior and capital flows that price charts miss entirely, but interpretation speed determines whether these signals generate profit. A smart money wallet accumulating tokens over three weeks while the price consolidates provides a different signal quality than an anonymous address making one large purchase.
Bullpen addresses the fragmentation problem by integrating discovery, verified trader performance data, and execution into a unified interface where spotting a setup and taking the position happen in the same environment without context switching or manual fund transfers.
Table of Content
Why Traders Rely on Multiple Crypto Analysis Tools
17 Best Crypto Analysis Tools for Traders
How to Choose the Right Crypto Analysis Tools for Your Strategy
Fewer Tools, Better Decisions
Make Trader Analysis and Buy Crypto Today with Bullpen
Why Traders Rely on Multiple Crypto Analysis Tools

The crypto market doesn't reward analysis. It rewards action informed by analysis. You can:
Study on-chain flows
Track smart money wallets
Identify breakout patterns across six different platforms
But if you can't move from insight to execution quickly, someone else already took the trade.
The Fragmented Search for a Competitive Edge
Most traders don't start with multiple tools because they want complexity. They start with one charting platform, realize it doesn't show wallet activity, add an on-chain explorer, discover they need sentiment context from social feeds, then layer in an execution platform that actually lets them trade what they've researched.
The stack grows because each tool solves one piece of a fragmented puzzle. According to Nansen, over 70% of professional crypto traders now use at least three different analytics platforms simultaneously. That's not a preference. That's a necessity in a market where edge comes from synthesis, not isolation.
The Hidden Cost of Fragmented Trading
The real cost isn't subscription fees. It's the cognitive load of switching contexts. You spot a wallet accumulating a token on Etherscan, flip to TradingView to check price structure, scan X for narrative momentum, then open your exchange to place the trade.
By the time you've toggled through four tabs, the price moved 8%, and the entry you wanted is gone. Speed matters, but so does confidence. When your tools don't talk to each other, every decision requires manual validation across disconnected interfaces.
Why Single-Platform Analysis Fails in Modern Crypto
Charting software shows historical prices. It doesn't show who bought, why they bought, or whether the move has legs beyond technical patterns.
On-chain tools reveal wallet behavior and capital flows, but they don't integrate sentiment or make it easy to act on what you're seeing. Social platforms surface narratives early, yet they lack the data layer to confirm whether hype matches reality.
Stop Trading Incomplete Pictures
The gap between these tools creates a specific failure mode. A trader sees a bullish chart setup, enters a position, and discovers that on-chain data show smart money exiting while retail is piling in. The chart looked clean because it only reflected the price.
It didn't reflect positioning, and positioning is often the trade. When your crypto analysis tools live in silos, you're trading incomplete pictures. You might be right about one signal and wrong about the context that determines whether that signal actually pays.
The High Stakes of Multi-Layer Market Synthesis
Professional traders don't use multiple platforms because they're indecisive. They use them because crypto moves across layers: spot price, perpetuals funding rates, on-chain accumulation, social sentiment, and prediction market odds.
Each layer generates alpha, but only if you can synthesize signals fast enough to act before the opportunity closes. The problem isn't that traders lack discipline. It's the infrastructure that forces them to choose between depth and speed.
The Execution Gap Most Traders Ignore
You can have the best crypto analysis and still lose money if execution is slow, expensive, or disconnected from your research environment. A trader identifies a token with strong on-chain accumulation and positive funding rates, then places an exchange order only to discover it isn't listed, liquidity is thin, or gas fees eat into expected profit. The insight was correct. The infrastructure couldn't support it.
Closing the Gap Between Analysis and Execution
This is where most setups break. Analysis happens in one place, execution in another, and the friction between them kills trades. You're not just losing time. You're losing the psychological momentum that comes from seeing an edge and acting on it immediately. Hesitation breeds second-guessing. Second-guessing breeds missed entries.
Platforms like Bullpen compress that gap by integrating discovery, analysis, and execution into a unified interface where spotting a trade and taking it happen in the same environment, with social proof from real trader performance layered in to validate your thesis before you commit capital.
Related Reading
17 Best Crypto Analysis Tools for Traders
1. Bullpen
Bullpen connects what most platforms separate:
Discovery
Analysis
Execution
You can trade Bitcoin, Solana memes, perpetual futures, and Polymarket prediction markets from a single interface that shows you what top-performing traders are actually doing, not what they claim they're doing.
The platform solves the verification problem that makes most social trading useless. Instead of following accounts based on follower count or perceived confidence, you follow traders with publicly visible profit-and-loss records. A live leaderboard ranks performance by actual returns, and notifications alert you when these traders open new positions. You're not guessing whether someone's thesis has merit. You're seeing whether their historical decisions generated profit.
From Insight to Action in Seconds
Direct execution means spotting a setup and taking the trade happen in the same environment. No switching to an exchange, no manual position entry, no friction between insight and action.
Crypto purchases can be made through Apple Pay or bank connections, eliminating funding delays that can kill time-sensitive opportunities. When a trader you follow enters a leveraged position on a token showing strong on-chain accumulation, you can mirror that trade in seconds rather than researching the token across three platforms while the price moves away from your intended entry.
Combining Insights with Action
The difference between Bullpen and traditional analysis tools is integration. Most platforms give you data.
Bullpen provides data, social proof of verified trader performance, and immediate execution capability. You're not just analyzing markets. You're acting on analysis that's already been validated by people whose track records you can inspect.
2. TradingView

TradingView dominates technical analysis by combining depth with usability. According to the Flipster Blog, the platform offers over 100 technical indicators, enabling traders to build complex multi-timeframe analyses without having to learn separate charting software for each asset class. Coverage extends beyond crypto to stocks, forex, and commodities, which matters when you're tracking correlations between Bitcoin and equity risk appetite or Ethereum and DXY movements.
TradingView suits traders whose edge comes from price structure, support and resistance levels, and indicator confluence. It doesn't show wallet activity or on-chain flows, so you're reading the price without context on who's moving it. That's fine if your strategy relies on technical patterns regardless of underlying positioning. It's insufficient if you need to know whether smart money is accumulating while retail sells into fear.
3. Glassnode
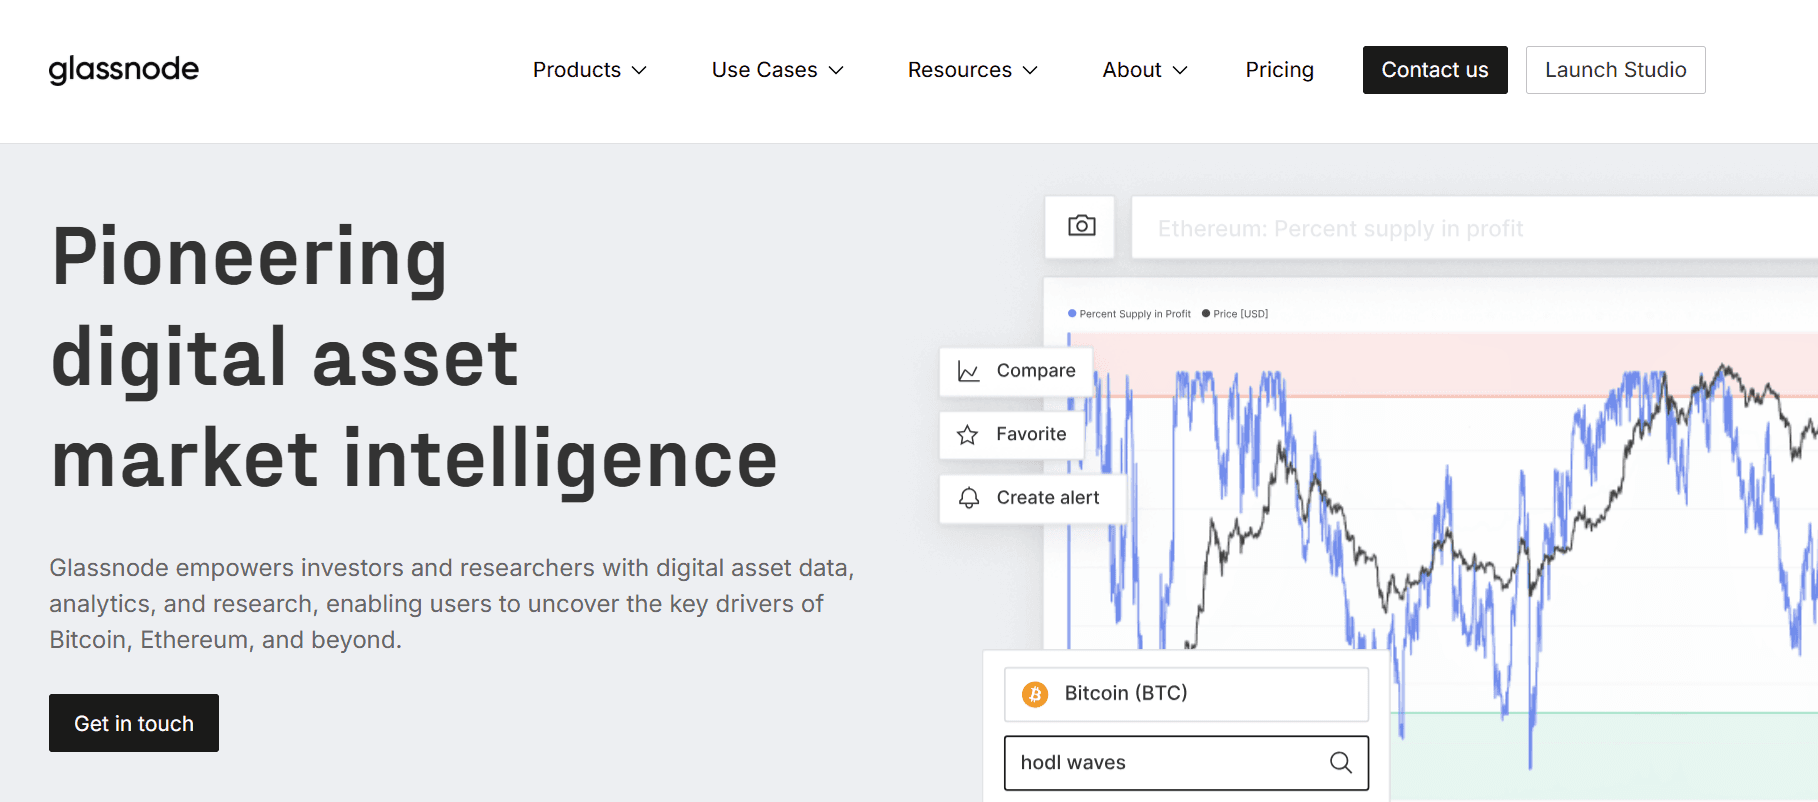
Price charts show what happened. Glassnode shows why it happened by tracking blockchain data that reveals market structure invisible in candlesticks. The platform analyzes wallet movements, exchange flows, holder profitability, and network activity metrics across Bitcoin and Ethereum, giving you insight into whether long-term holders are distributing into strength or accumulating during drawdowns.
Metrics such as SOPR (Spent Output Profit Ratio) indicate whether coins moving on-chain are being sold at a profit or a loss, indicating whether current price action represents capitulation or profit-taking. Exchange netflows reveal whether coins are moving onto exchanges (potential selling pressure) or into cold storage (reduced liquid supply). Holder composition data shows how many coins are held by short-term speculators versus long-term investors, helping you gauge conviction levels across different market participants.
4. CoinGecko
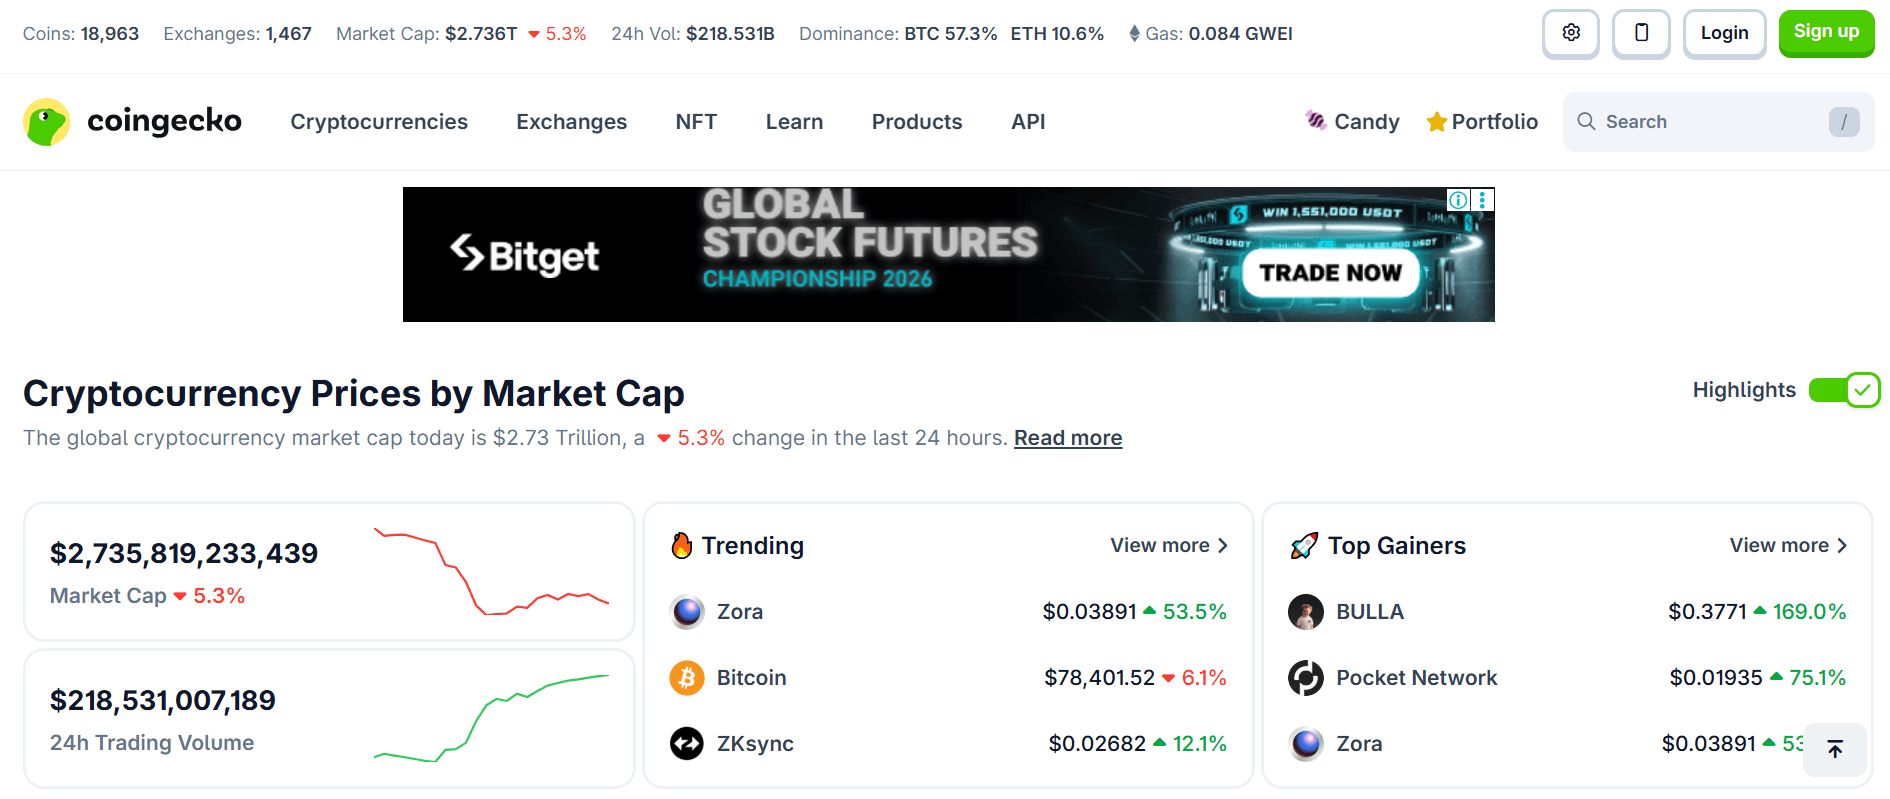
CoinGecko aggregates data on thousands of cryptocurrencies, providing real-time pricing from multiple exchanges, historical charts, trading volume, and market cap rankings. The platform includes core project information: team details, whitepapers, social media metrics, and community activity scores. CoinGecko is suitable for traders who need a broad market overview and fundamental research on altcoins outside the top 50 by market cap.
When you're evaluating a low-cap token, CoinGecko provides the initial due diligence layer: who built it, how active the community is, where it's listed, and the circulating supply versus total supply. It won't tell you whether smart money is buying or whether funding rates suggest overleveraged longs. It provides baseline data to determine whether something warrants further research.
5. CoinMarketCap
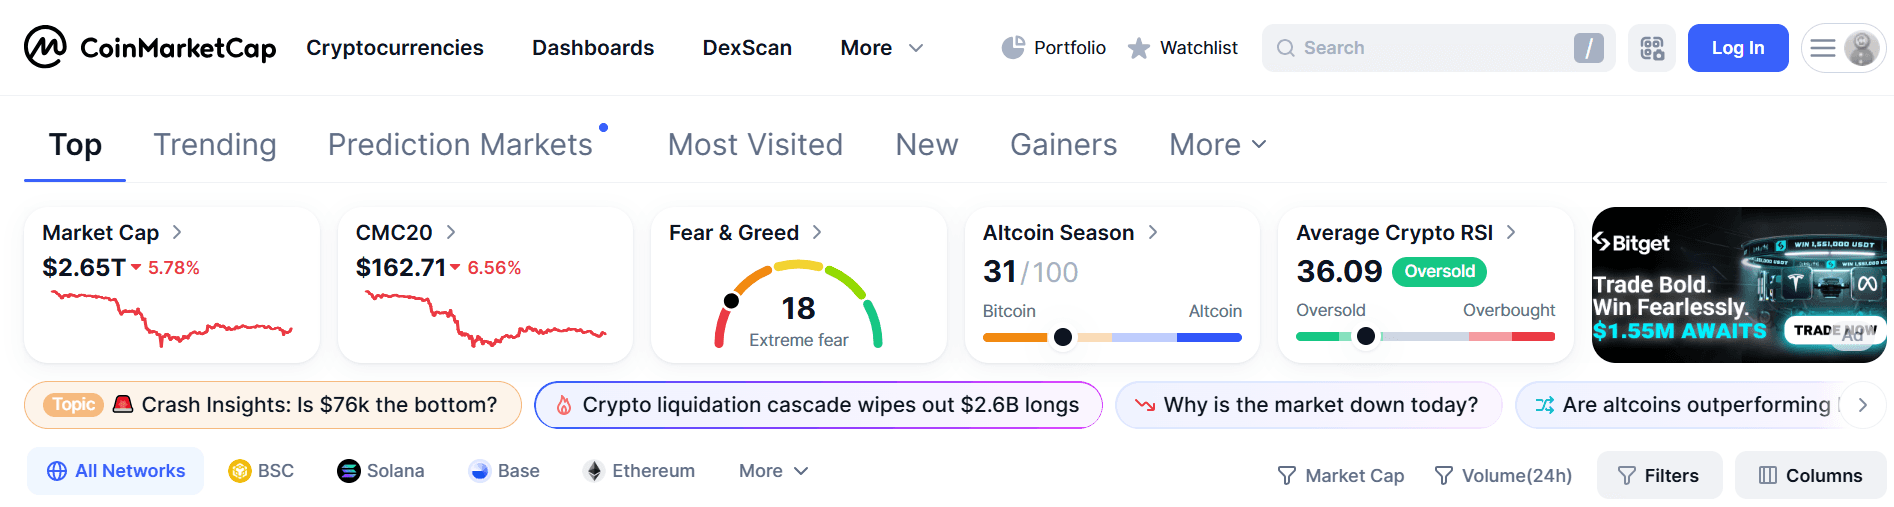
CoinMarketCap offers functionality similar to CoinGecko, including real-time price tracking, historical charts, market cap rankings, and exchange listings. The platform includes educational content, ICO calendars, and derivatives market data showing futures and options activity across major exchanges.
CoinMarketCap suits traders wanting established infrastructure and broad market visibility. It's often the first place retail checks prices, which means high-traffic listings can drive attention and volume to newly listed tokens. If you're trading momentum based on listing announcements or exchange additions, CoinMarketCap data shows which platforms added which assets and when.
6. Nansen
Nansen tracks blockchain wallet activity across funds, institutions, influential traders, and protocols, and then analyzes what those “smart money” addresses buy, sell, or hold. Instead of seeing anonymous wallet activity, you see that Wallet X belongs to a venture fund with a strong track record, and that wallet just accumulated 50,000 tokens of a project that hasn't announced anything publicly yet.
Nansen suits traders who follow sophisticated investors' on-chain activity rather than waiting for delayed public announcements. By the time a fund announces a position in a quarterly letter, the price already moved. Nansen shows you the accumulation in real time, allowing you to follow or fade based on your analysis of the opportunity.
The Limits of Following Smart Money
A smart money wallet purchase doesn't guarantee the trade will succeed. It means someone with resources and, presumably, skills believes it's worth buying. You still need conviction in the thesis and risk management around the position.
7. Dune Analytics
Dune Analytics lets you query blockchain data directly through SQL, creating custom dashboards that track specific metrics, protocols, or wallet behaviors. Community-built dashboards analyze popular protocols, tokens, and market metrics, providing starting points for building custom queries.
The platform suits data-savvy traders wanting customizable analytics beyond standard offerings. If you're tracking a specific DeFi protocol's revenue, user growth, or treasury composition, Dune lets you build the exact query that surfaces that data rather than hoping a third-party dashboard includes it.
The Barrier is a Technical skill
Writing SQL queries requires programming knowledge that most traders lack. If you can code or learn basic query syntax, Dune offers analytical depth that no prebuilt dashboard can match. If you can't, you're limited to community dashboards that may not track the metrics you care about.
8. Messari
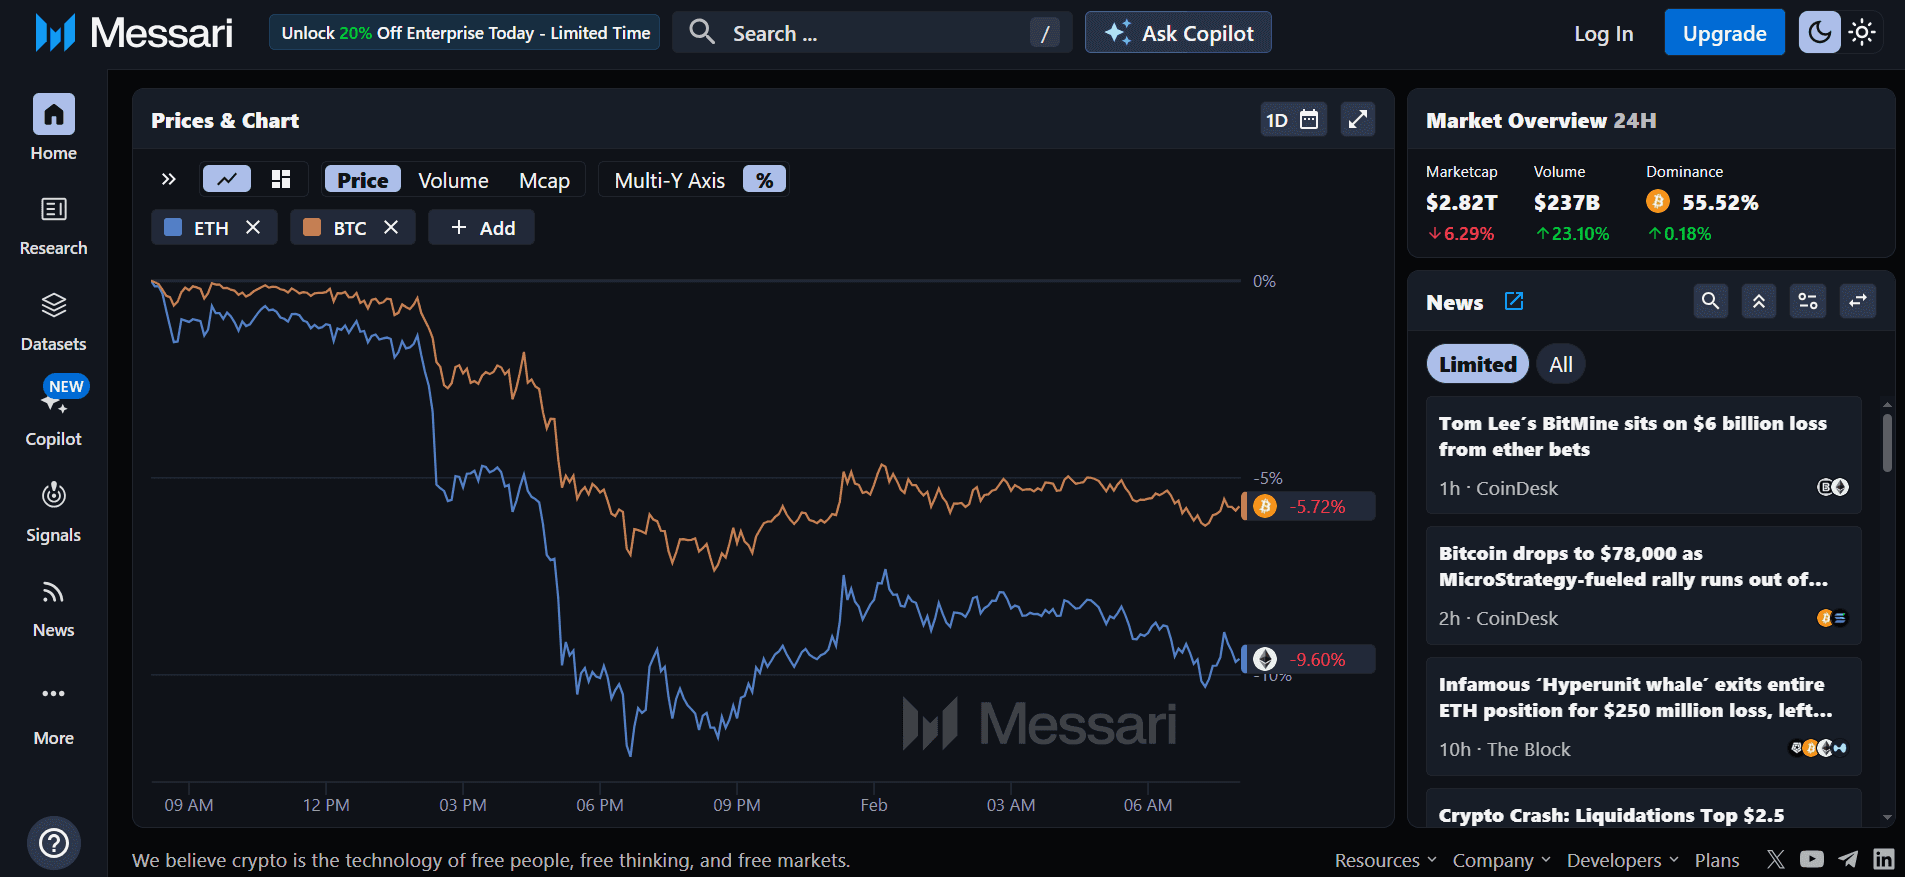
Messari provides in-depth research reports on crypto projects, protocol fundamentals, governance proposals, and market trends. The platform tracks tokenomics, unlock schedules, treasury data, and developer activity, providing the fundamental analysis layer most platforms overlook.
Messari suits traders conducting fundamental research on crypto projects and tracking long-term trends. It won't help you time a swing trade based on technical patterns. It will help you identify protocols with sustainable business models, strong developer activity, and tokenomics that align incentives between users and token holders.
9. Santiment
Santiment combines on-chain data, social sentiment, and development activity metrics into a platform that identifies divergences between price movement and fundamental metrics. The platform tracks blockchain metrics alongside social volume (the extent to which projects are discussed), sentiment analysis of that discussion, and GitHub development activity.
Santiment suits traders, incorporating social sentiment and development activity into analysis. The limitation is signal quality. Social volume spikes often lag price movements rather than lead them, and sentiment analysis struggles with sarcasm, context, and distinguishing genuine enthusiasm from coordinated shilling.
10. LunarCrush

LunarCrush aggregates social media data from Twitter, Reddit, YouTube, and other platforms, measuring social volume, sentiment, and influencer engagement for cryptocurrencies. The platform's "Galaxy Score" combines multiple social metrics into overall rankings to identify projects gaining momentum before their prices follow.
LunarCrush is designed for traders who use social momentum as a leading indicator of price movements. When a token's social volume increases while sentiment remains positive and influencer engagement rises, that combination suggests growing attention that may drive buying pressure. The challenge is distinguishing organic momentum from coordinated campaigns designed to create the appearance of interest.
11. Coinglass
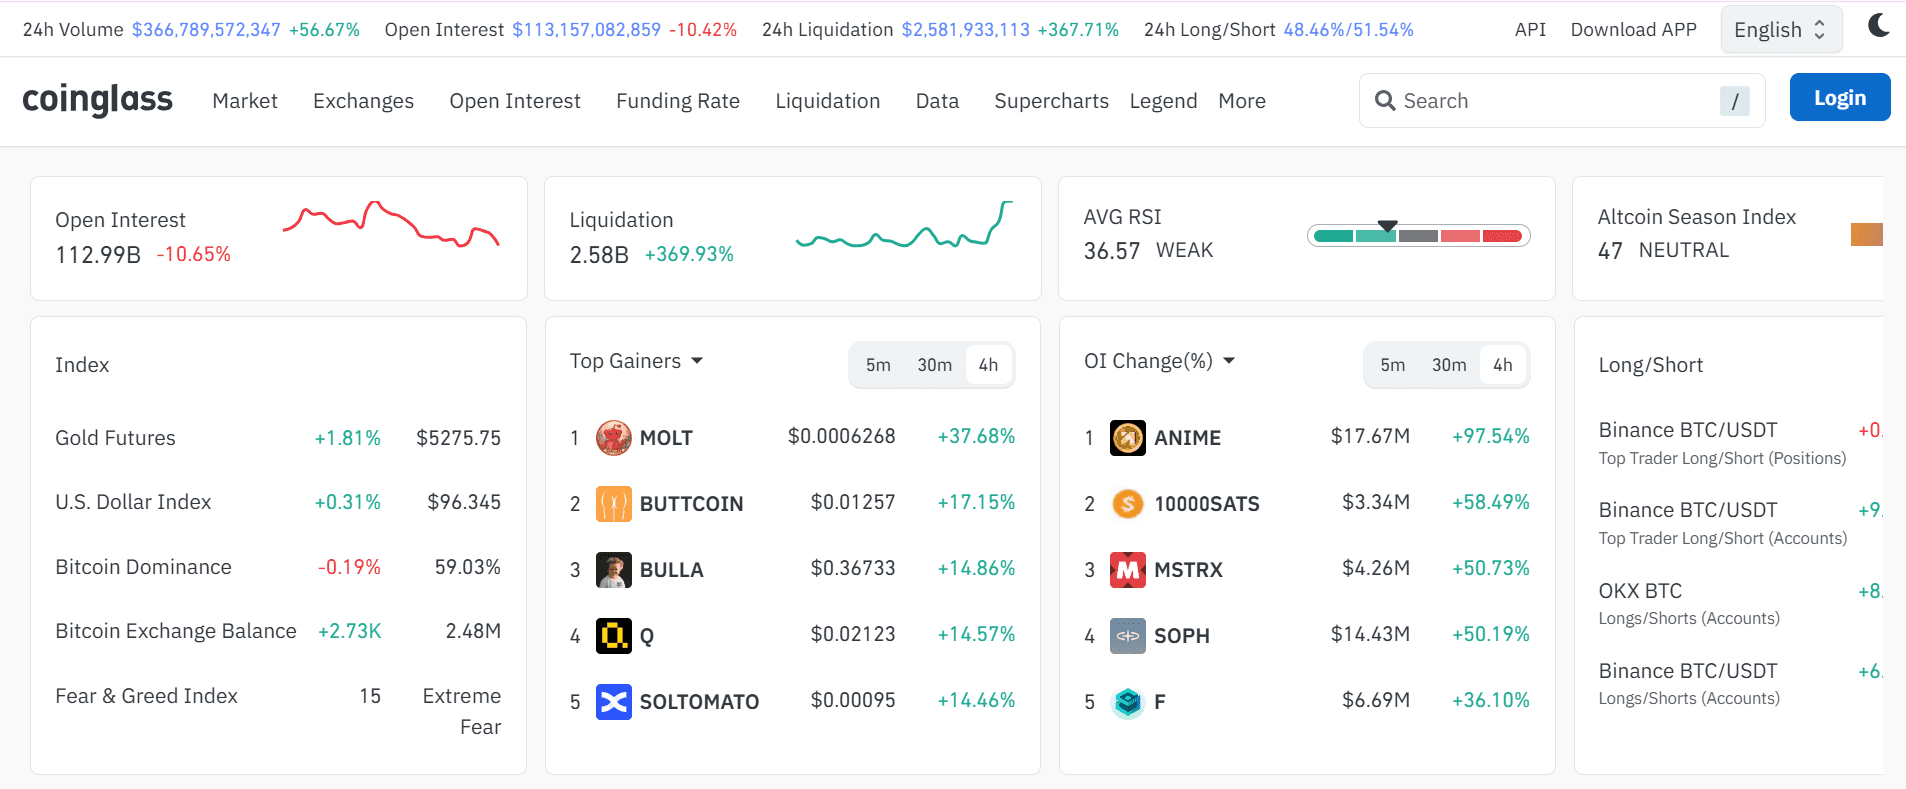
Coinglass specializes in derivatives market data, tracking funding rates, open interest, liquidations, and options metrics across major exchanges. Funding rates show whether perpetual futures traders are net long (paying to hold long positions) or net short (paying to hold short positions), indicating positioning bias that can lead to squeezes when overleveraged.
Coinglass suits derivatives traders and those using futures market data to gauge market positioning. When funding rates reach extreme positive levels, it suggests overleveraged longs are vulnerable to liquidation cascades if the price reverses. When funding rates turn deeply negative, it suggests overleveraged shorts that can fuel short squeezes on positive news.
12. DeFi Llama
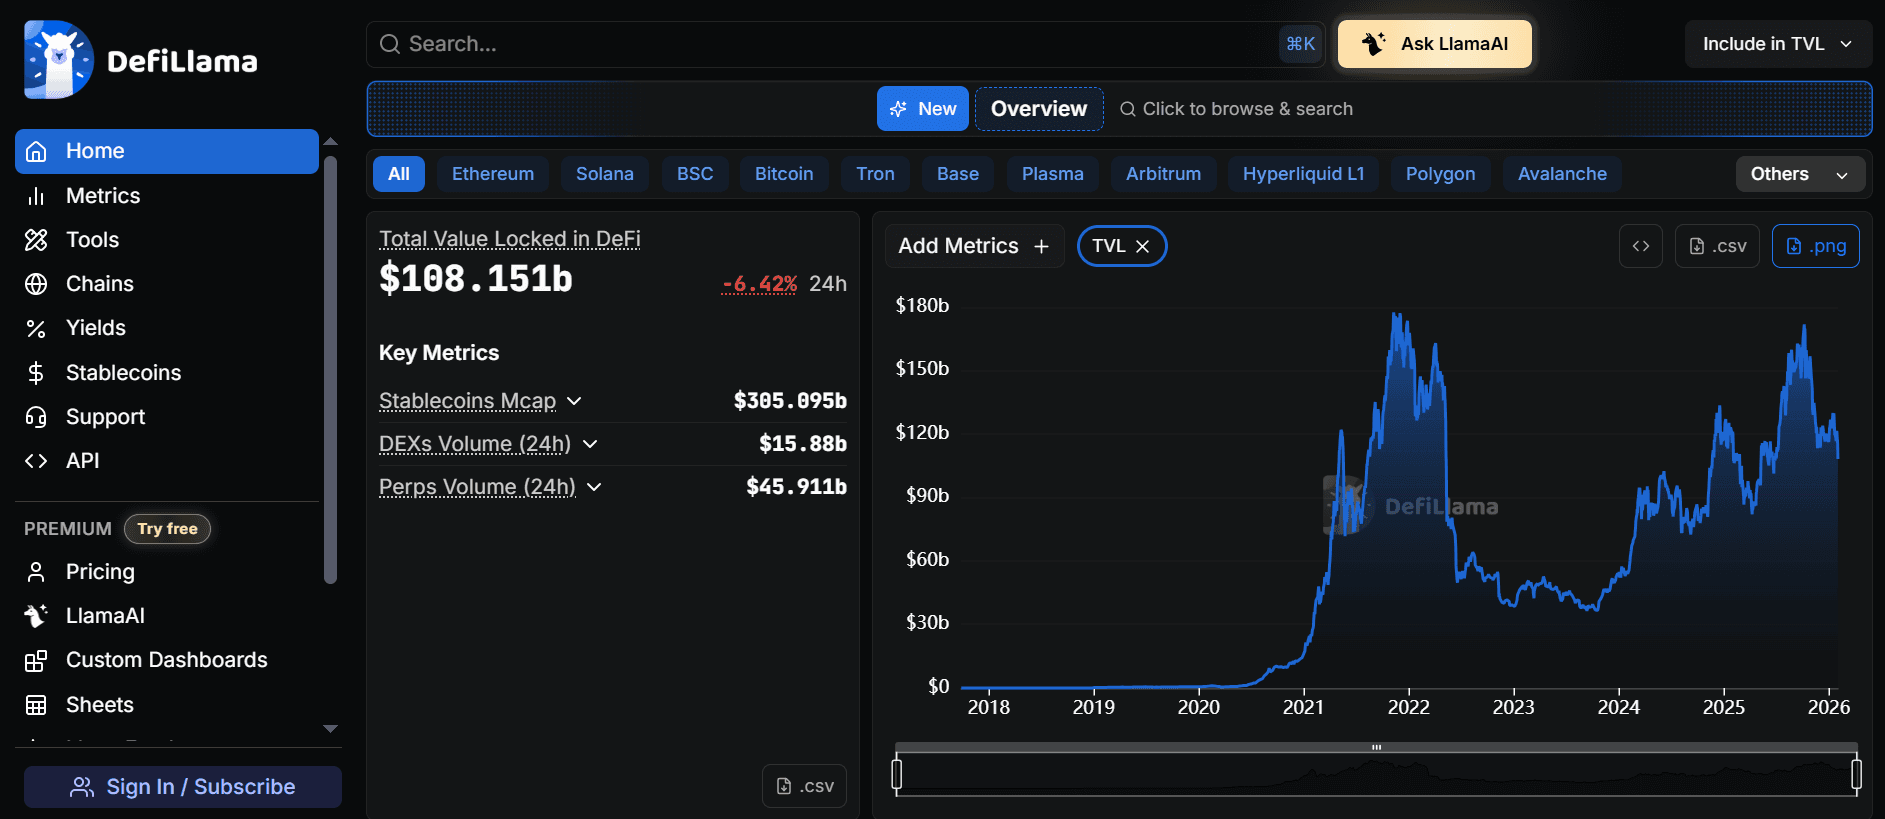
DeFi Llama aggregates data from DeFi protocols, showing total value locked, yield opportunities, protocol revenues, token unlocks, and governance information. The platform covers lending, DEXs, derivatives, and other DeFi categories across multiple blockchains, providing a comprehensive view of capital flows in decentralized finance.
DeFi Llama serves traders active in DeFi protocols and yield-farming opportunities. It won't help you time a Bitcoin swing trade. It will help you identify which lending protocols offer competitive rates, which DEXs have the deepest liquidity, and which protocols are gaining or losing market share.
13. Token Terminal
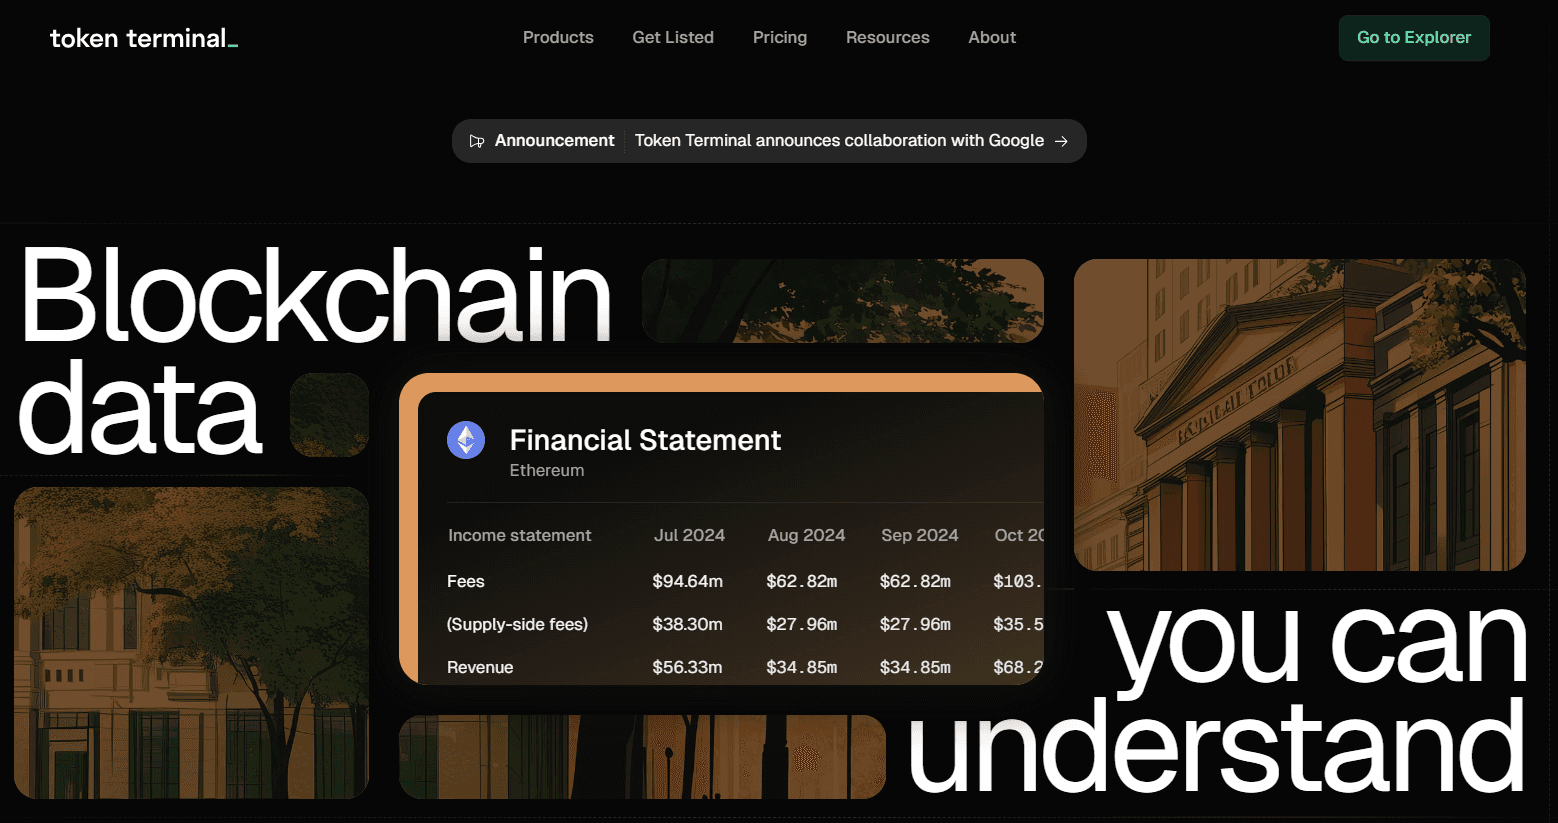
Token Terminal provides revenue, fees, price-to-sales ratios, and other traditional financial metrics for crypto protocols, enabling valuation comparisons similar to equity analysis. The platform tracks protocol revenue, token-holder value accrual, and usage metrics, giving you the tools to evaluate whether a token is over- or undervalued based on fundamental business metrics.
Token Terminal suits traders with traditional finance backgrounds applying fundamental analysis frameworks to crypto. The limitation is that many crypto protocols don't generate revenue in ways comparable to traditional companies, and token value doesn't always accrue from protocol revenue.
14. Arkham Intelligence
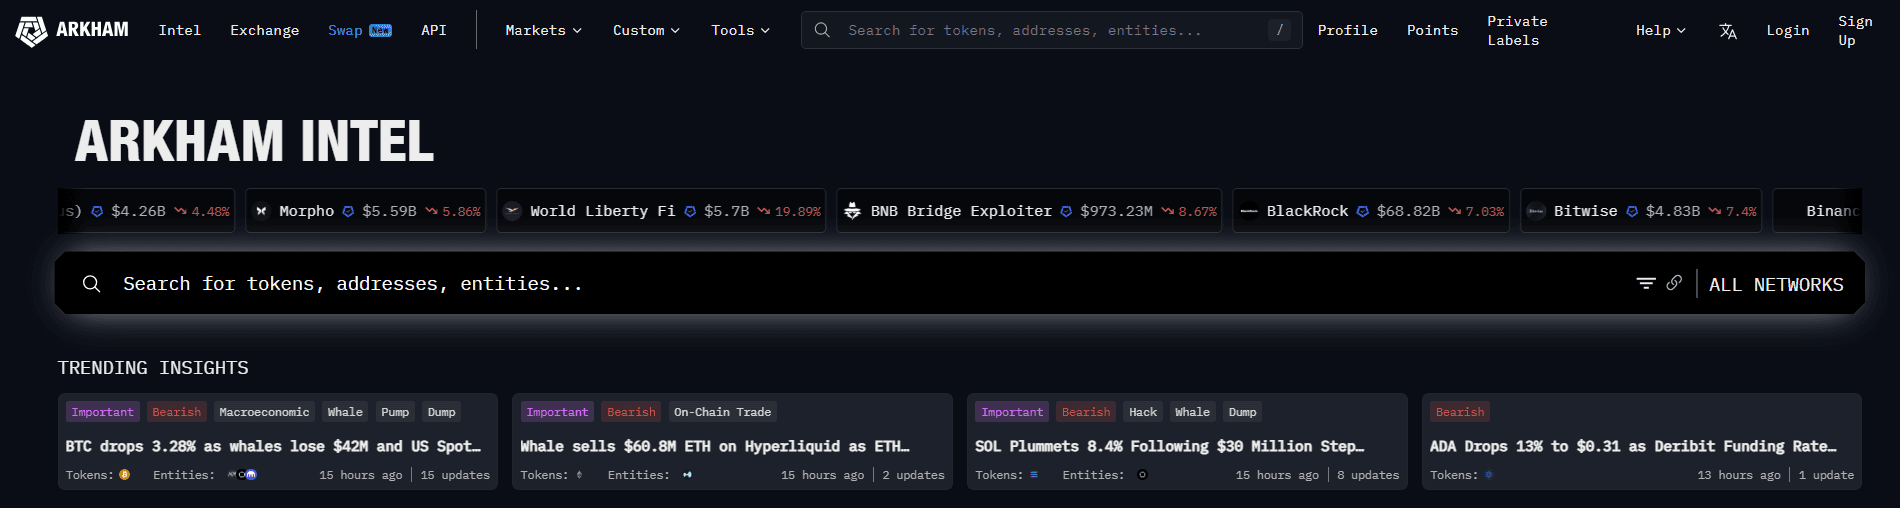
Arkham labels blockchain addresses with real-world entities (e.g., exchanges, funds, and prominent individuals) and tracks fund flows between them. The platform's “Intel Exchange” allows users to request or provide information about specific addresses, creating a marketplace for blockchain intelligence.
Arkham suits traders who investigate specific wallets, track whale movements, or research token holder composition. When a wallet associated with a known fund moves large amounts of a token, that movement signals conviction or an exit. When exchange wallets show large inflows, that suggests potential selling pressure as holders move coins to platforms where they can be sold.
The Importance of Interpreting Data Context
Whale movements don't always signal intent. A wallet transferring tokens to an exchange may be preparing to sell, providing liquidity, or moving to a different custody solution. Context matters, and Arkham provides the data but not the interpretation.
15. IntoTheBlock
IntoTheBlock uses machine learning to analyze blockchain data, providing metrics such as in- and out-of-money indicators (showing where holders bought their positions), concentration metrics, large-transaction tracking, and predicted price levels. The platform supports multiple blockchains and DeFi protocols and applies AI-enhanced pattern recognition to on-chain data.
IntoTheBlock serves traders seeking AI-enhanced pattern recognition on on-chain data. The limitation is that machine learning models are only as good as their training data and assumptions, and crypto markets evolve faster than models can adapt.
16. Cryptoquant

Cryptoquant provides exchange flow data, miner behavior analysis, stablecoin metrics, derivatives market data, and network fundamentals. The platform offers professional-grade charts and the ability to create custom indicators that combine various metrics, providing institutional traders and serious retail analysts with comprehensive on-chain and derivatives data.
Cryptoquant serves institutional traders and serious retail analysts who require comprehensive data across multiple signal types. The platform assumes you know what metrics matter for your strategy and how to interpret them in context.
17. The Tie
The Tie aggregates news, social media, and blockchain data into sentiment scores and trading signals. The platform analyzes the impact of news on prices, tracks insider development activity, and provides customizable alerts when specific conditions are met.
The Tie suits quantitative traders, incorporating alternative data signals into systematic strategies. The limitation is that sentiment analysis and news impact quantification remain imprecise, and by the time news is published, the price has often already moved on the information.
How to Choose the Right Crypto Analysis Tools for Your Strategy

The right setup isn't the one with the most capabilities. It's the one that removes friction between recognizing an opportunity and acting on it. Your trading style determines which signals matter, and which signals matter determines which tools belong in your stack. Start by identifying where your edge comes from, then work backward to the minimum infrastructure required to support it without adding steps between insight and execution.
Technical Traders: Speed Over Complexity
If your edge lives in price structure, support and resistance zones, and indicator confluence, execution speed matters more than data breadth. You need charts that load instantly, indicators that update in real time, and order entry that happens without switching platforms or re-entering position details manually.
Optimizing Your Technical Workflow
Clean multi-timeframe layouts help you confirm that the four-hour breakout aligns with the daily structure and isn't just noise within a larger range. Saved workspaces mean you're not rebuilding your chart setup every session, losing time to formatting instead of trading.
Alert systems notify you when prices approach key levels, but only if those alerts are connected directly to execution capability. An alert that makes you open three tabs to place a trade isn't solving the problem.
On-Chain Traders: Context Before Commitment
On-chain data shows what's happening. It doesn't always explain why. A wallet transferring 100,000 tokens to an exchange could signal selling pressure, liquidity provision, custody reorganization, or preparation for an OTC deal.
Context determines whether the signal matters. Tools that surface transactions without classification or historical behavior patterns leave interpretation entirely to you, which slows decision-making when timing matters most.
Momentum and Narrative Traders: Discovery Feeds Timing
Memecoins and narrative-driven tokens move on attention, not fundamentals. The edge comes from spotting shifts in conversation volume and sentiment before they translate into buying pressure. Speed matters more than precision because these moves occur quickly and reverse quickly.
Most traders chasing momentum lose because they enter after the move already happened. They see a token trending on social platforms, check the chart, see it's up 200% in six hours, and buy into strength, hoping for a continuation. Sometimes it works. Often it doesn't, because the attention that drove the initial move is already fading by the time late participants arrive.
Copy-Style Traders: Transparency Eliminates Guesswork
Following other traders only works if you can verify their performance. Self-reported win rates and screenshot victories don't prove anything. Verified profit and loss records do.
The problem with most social trading approaches is that popularity doesn't correlate with profitability. An account with 50,000 followers might be great at engagement and terrible at trading. Without transparent performance data, you're guessing whether someone's thesis has merit based on confidence and presentation rather than results.
Replace Guesswork with Verified Performance and Instant Execution
Platforms that show real-time performance metrics, historical win rates, and current positions eliminate that guesswork. When you follow a trader, you're not trusting their marketing. You're following a track record you can inspect. Notifications when top performers open new positions let you mirror trades while the opportunity still exists, not after they've already closed the position and posted about it.
Platforms like Bullpen address this by displaying verified traders' performance alongside execution capabilities within a single interface. You can see who's profitable, what they're trading, and mirror positions without leaving the platform. The friction between seeing a trade and taking it collapses from minutes to seconds, which matters when following time-sensitive opportunities.
The Filtering Principle
Across every trading style, the same pattern emerges. More data doesn't create better decisions. Faster filtering does. The tools that improve performance aren't the ones that show you everything. They're the ones that show you what matters for your strategy and remove the steps between seeing it and acting on it.
When charting, on-chain analysis, sentiment tracking, and execution live in separate platforms, every trade requires manual synthesis. You're the integration layer, which means you're also the bottleneck. Your speed, attention, and ability to hold multiple contexts in your head determine how quickly you move from signal to position.
Closing the Gap Between Insight and Action
Unified platforms that connect analysis to execution don't just save time. They change decision quality. When you can see a setup, validate it against relevant data, and execute the trade without switching contexts, decisions become cleaner.
You're not second-guessing whether you remembered the on-chain signal correctly or whether sentiment shifted while you were toggling between tabs. The information and the action exist in the same space, reducing cognitive load and eliminating the friction that creates hesitation.
Related Reading
Fewer Tools, Better Decisions

Consolidation isn't about minimalism. It's about reducing the cognitive load of constantly switching between environments.
When your analysis lives in one place, your execution in another, and your validation in a third, every decision requires you to hold multiple contexts in your head simultaneously. That mental overhead creates hesitation, and hesitation in crypto costs money.
The Switching Cost Nobody Tracks
The American Psychological Association's research on task switching shows that productivity drops by up to 40% when people frequently switch between tasks or tools. In trading terms, that's not abstract productivity loss.
It's the difference between catching an entry at the level you wanted and chasing it three percent higher because you spent ninety seconds toggling between your charting platform, on-chain explorer, and exchange.
Why More Data Degrades Decisions
According to Gartner, 72% of companies use 10 or more different tools for data analysis. That fragmentation creates a specific failure mode. Instead of gaining clarity from multiple perspectives, traders are overwhelmed by conflicting signals that all seem important.
One tool shows bullish on-chain accumulation. Another shows negative funding rates, suggesting overleveraged longs. A third shows declining social sentiment.
Which signal matters most?
The answer depends on your strategy, but when you're juggling ten inputs across six platforms, that prioritization occurs under cognitive load rather than with clear conviction.
The Speed Advantage of Tool Consolidation
When teams consolidate around three or fewer business intelligence tools, McKinsey & Company reports 40% faster decision-making. The improvement doesn't come from better data. It comes from eliminating the friction between seeing something and acting on it.
In crypto, that translates directly to execution quality. Faster decisions lead to better entries, tighter stops, and the psychological momentum that comes from acting on conviction rather than hesitating in the face of doubt.
The Real Competitive Edge
Winning traders optimize for the cleanest loop between insight, context, and action. They don't chase comprehensive coverage. They chase speed to conviction. That means choosing tools that surface the signals on which their strategy depends, validate those signals with relevant context, and connect directly to execution without forcing manual synthesis across disconnected platforms.
Platforms that integrate discovery, analysis, and execution into a unified environment compress the decision loop from minutes to seconds. Bullpen does this by displaying verified traders' performance alongside execution capabilities within the same interface. You can see who's profitable, what they're trading, and mirror positions without leaving the platform or rebuilding context on why the trade matters.
Consolidation as Strategy
Better trading doesn't come from adding capabilities. It comes from removing obstacles between insight and execution. Every tool you eliminate is one fewer context switches, one fewer login, one fewer place where information gets lost or delayed.
The goal isn't to use fewer tools because minimalism feels virtuous. It's about using fewer tools because fragmentation has measurable costs that show up as missed trades, delayed reactions, and the accumulated mental fatigue of holding too many contexts simultaneously.
The Power of Focused Execution
When your stack is streamlined, decisions improve not because you know more, but because you can act on what matters without delay. Your reactions get faster. Your execution gets cleaner. Your confidence increases because you're not constantly wondering whether you missed a signal in a different tab or whether the context changed while you were switching platforms.
The edge isn't having more data. It's having the right data integrated into your execution environment, with verification that the signals you're following actually correlate with profitable outcomes rather than just sounding sophisticated.
Make Trader Analysis and Buy Crypto Today with Bullpen
If you're tired of jumping between charting tools, wallets, exchanges, and Twitter threads just to make one decision, the problem isn't your strategy. It's fragmentation.
Trade Like the Best Without Leaving the App
Bullpen brings crypto analysis and trading into one place. You can follow top traders on X with verified PNLs, see who's actually winning on a live leaderboard, and get notified the moment proven performers open a position.
Then you can act immediately without switching apps or moving funds. Trade Bitcoin, Solana memes, perps, and prediction markets in a single app. Buy crypto with Apple Pay or your bank account, use leverage when it fits your strategy, and execute with speed when timing matters most.
If you're ready to trade with less friction and better context, deposit today to earn a 500-point bonus. Deposit $1,000 or more, and you'll also get a free introductory call to help you get set up the right way. Trade smarter, faster, and in one app with Bullpen.
Related Reading
Last Updated:
February 7, 2026